Copyright
©2006 Baishideng Publishing Group Co.
World J Gastroenterol. Aug 7, 2006; 12(29): 4727-4735
Published online Aug 7, 2006. doi: 10.3748/wjg.v12.i29.4727
Published online Aug 7, 2006. doi: 10.3748/wjg.v12.i29.4727
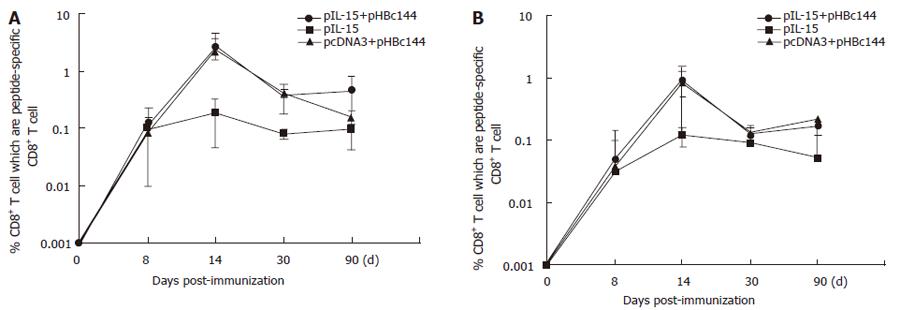
Figure 5 Kinetics of antigen-specific CD8+ T-cell response in spleen (A) and PBMCs (B) following DNA immunization.
Mice were immunized with pHBc144 plasmid DNA or vector DNA intramuscularly. At various time points, splenocytes and PBMCs were harvested, stimulated for 5 h with specific peptide, double stained with anti-CD8a-PE and anti-IFN-γ-APC. A total of 1 × 10⁵ events were acquired by a flow cytometer. The indicated values on the lines of the figure (plotted on a log10 scale) reflect the percentage of peptide-specific CD8+ T-cells to total CD8+ T-cells in the spleens or PBMCs (about three mice/group at each time point). The cut-off value was 0.1%.
- Citation: Zhang W, Dong SF, Sun SH, Wang Y, Li GD, Qu D. Coimmunization with IL-15 plasmid enhances the longevity of CD8 T cells induced by DNA encoding hepatitis B virus core antigen. World J Gastroenterol 2006; 12(29): 4727-4735
- URL: https://www.wjgnet.com/1007-9327/full/v12/i29/4727.htm
- DOI: https://dx.doi.org/10.3748/wjg.v12.i29.4727


