Copyright
©2006 Baishideng Publishing Group Co.
World J Gastroenterol. Jan 14, 2006; 12(2): 271-279
Published online Jan 14, 2006. doi: 10.3748/wjg.v12.i2.271
Published online Jan 14, 2006. doi: 10.3748/wjg.v12.i2.271
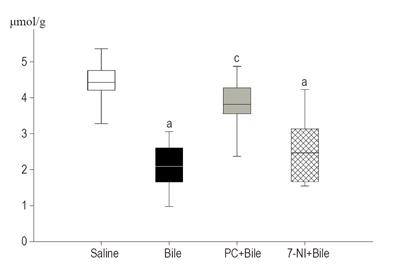
Figure 1 Effects of bile (black box), PC+bile (gray box) and 7-NI+bile (checked box) on the ATP content of esophageal mucosa.
The plots demonstrate the median (horizontal line in the box), the 25th (lower whisker) and 75th (upper whisker) percentiles, respectively. aP < 0.05 between groups vs saline-treated control group. cP < 0.05 between bile+7-NI-treated and bile+PC-treated groups vs bile-treated group values.
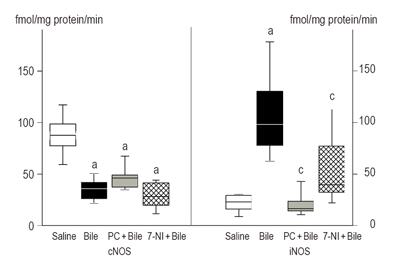
Figure 2 Changes in constitutive (left panel) and inducible NOS (right panel) activities [fmol (mg protein)-1/min] in esophageal tissue from saline-treated (empty box), bile-treated (black box), bile+PC-treated (gray box) and bile+7-NI-treated (checked box) animals.
The plots demonstrate the median (horizontal line in the box), the 25th (lower whisker) and 75th (upper whisker) percentiles, respectively. aP < 0.05 between groups vs saline-treated control group values. cP < 0.05 between bile+7-NI-treated and bile+PC-treated groups vs bile-treated group values.
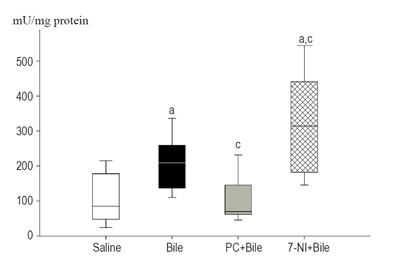
Figure 3 Myeloperoxidase (MPO) activity in the esophageal mucosa 180 min after treatment.
The plots demonstrate the median (horizontal line in the box), the 25th (lower whisker) and 75th (upper whisker) percentiles, respectively. aP < 0.05 between groups vs saline-treated control group values. cP < 0.05 between bile+7-NI-treated and bile+PC-treated groups vs bile-treated group values.
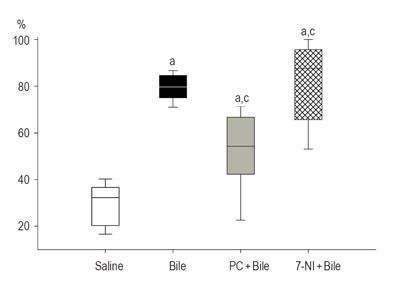
Figure 4 Mast cell degranulation (%) in the esophageal mucosa 180 min after treatment.
The plots demonstrate the median (horizontal line in the box) and the 25th (lower whisker) and 75th (upper whisker) percentiles. aP<0.05 between groups vs saline-treated control group values. cP<0.05 between bile+7-NI-treated and bile+PC-treated groups vs bile-treated group values.
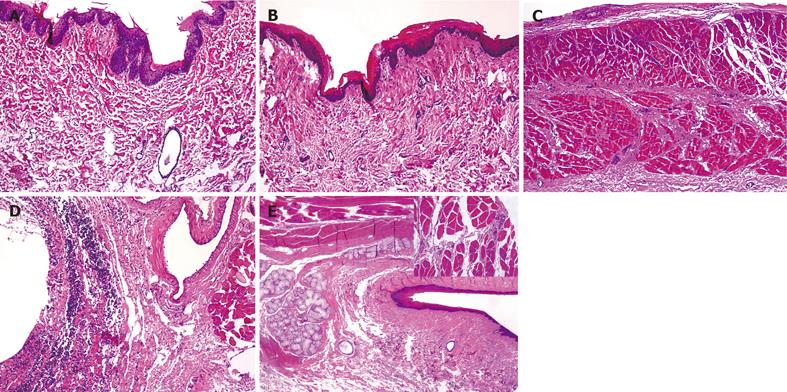
Figure 5 Photomicrographs of esophageal wall from groups 1- 4 (H&E staining).
A: control group (saline treatment, original magnification x 224), B: bile treatment (epithelial damage and subepithelial edema, original magnification x 112), C: bile-treated group (significant leukocyte infiltration in the muscle layers and adventitia, original magnification x 112), D: bile + 7-NI treatment (extreme leukocyte infiltration in the adventitia, original magnification x 224), and E: bile + PC treatment (no significant change in the esophageal wall, original magnification x 56x; the arrow in the right upper corner shows the muscle layer of the same field (original magnification x 400); the interstitial capillaries are filled with PMNs, but only few extravasated PMNs are present).
- Citation: Eros G, Kaszaki J, Czobel M, Boros M. Systemic phosphatidylcholine pretreatment protects canine esophageal mucosa during acute experimental biliary reflux. World J Gastroenterol 2006; 12(2): 271-279
- URL: https://www.wjgnet.com/1007-9327/full/v12/i2/271.htm
- DOI: https://dx.doi.org/10.3748/wjg.v12.i2.271


