Copyright
©2006 Baishideng Publishing Group Co.
World J Gastroenterol. Jan 14, 2006; 12(2): 271-279
Published online Jan 14, 2006. doi: 10.3748/wjg.v12.i2.271
Published online Jan 14, 2006. doi: 10.3748/wjg.v12.i2.271
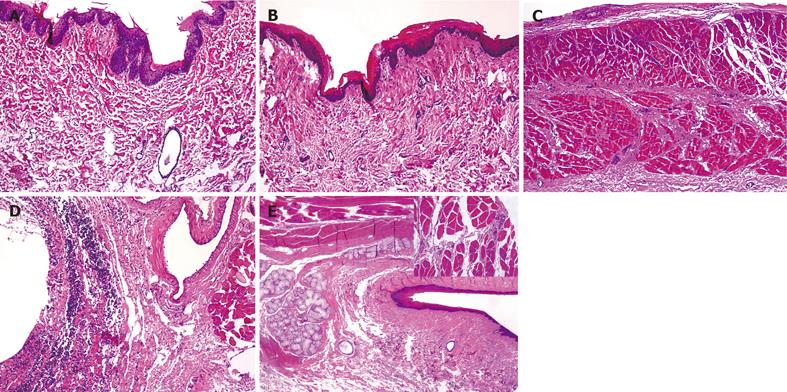
Figure 5 Photomicrographs of esophageal wall from groups 1- 4 (H&E staining).
A: control group (saline treatment, original magnification x 224), B: bile treatment (epithelial damage and subepithelial edema, original magnification x 112), C: bile-treated group (significant leukocyte infiltration in the muscle layers and adventitia, original magnification x 112), D: bile + 7-NI treatment (extreme leukocyte infiltration in the adventitia, original magnification x 224), and E: bile + PC treatment (no significant change in the esophageal wall, original magnification x 56x; the arrow in the right upper corner shows the muscle layer of the same field (original magnification x 400); the interstitial capillaries are filled with PMNs, but only few extravasated PMNs are present).
- Citation: Eros G, Kaszaki J, Czobel M, Boros M. Systemic phosphatidylcholine pretreatment protects canine esophageal mucosa during acute experimental biliary reflux. World J Gastroenterol 2006; 12(2): 271-279
- URL: https://www.wjgnet.com/1007-9327/full/v12/i2/271.htm
- DOI: https://dx.doi.org/10.3748/wjg.v12.i2.271


