Copyright
©2006 Baishideng Publishing Group Co.
World J Gastroenterol. Mar 28, 2006; 12(12): 1881-1888
Published online Mar 28, 2006. doi: 10.3748/wjg.v12.i12.1881
Published online Mar 28, 2006. doi: 10.3748/wjg.v12.i12.1881
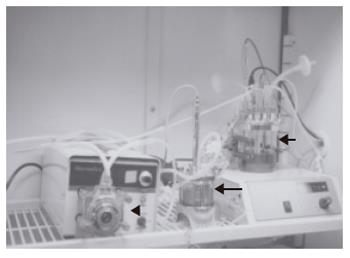
Figure 1 The system of radial-flow bioreactor.
A 15-mL radial-flow bioreactor (large arrow), a mass flow controller (arrow head), and a reservoir (small arrow) are connected each other. Culture medium is perfused in the RFB. Medium conditions (PH, oxygen, CO2 and temperature) are controlled by computer.
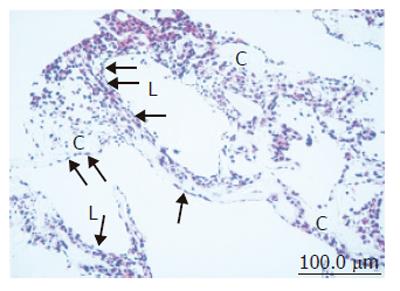
Figure 2 Light microscopic image of coculture in the RFB.
High-density and layered cells attached on the cellulose beads (C). Sinusoid-like lumen structure (L) could be observed. SEC was observed with flat shape on surface of the lumen and perfusion side (arrow).
Figure 3 Transmission electron microscopic images of cocultures in the RFB.
A: The cells are arrayed on the cellulose beads. Several cell clusters could be seen in a gap of cellulose beads (arrow). Vascular lumen structure surrounding cell clusters could be seen in the beads (small arrow). Culture media flow through inside of lumen structure; B: The cells are arrayed in layers on cellulose beads. Part of a cellulose bead (arrow) is visible at the bottom of the layer. A process of a sinusoidal endothelial cell (arrowhead) is seen at the perfusion side. Scale bar: 5 μm; C: Sinusoidal endothelial cells (EC) can be seen at the perfusion side. Hepatic stellate cells (SC) containing fatty vitamin A droplets are seen overlying the FLC-5 cells (H). FLC-5 cells (H) below EC and SC show bile-canaliculus-like structures (B). Scale bar: 5 μm. D: Bile canaliculus-like structures (B) containing electron dense bile components. Tight junctions (t) and desmosomes (d) are visible, as are fatty vitamin A droplets (L). Scale bar: 2 μm.
Figure 4 Ultrastructure of sinusoidal endothelial cells.
A: Scanning electron microscopic image of sinusoidal endothelial cells localized at the perfusion side. They form a thin layer (arrowhead), showing the typical appearance of a sinusoid-like vascular structure. Scale bar: 5 μm; B: Transmission electron microscopic image showing sinusoidal endothelial cell growth at the perfusion side forming a thin layer (arrowhead) overlying the A7 cells (SC). Scale bar: 1 μm; C: Transmission electron microscopic view showing tight junctions (arrow) between sinusoidal endothelial cells (EC). Scale bar: 200 nm.
Figure 5 Scanning electron microscopic image of the surface of sinusoidal endothelial cells.
A: Low-magnification scanning electron microscopic images of the surface of sinusoidal endothelial cells cultured on plastic dishes. The sinusoidal endothelial cells formed a thin layer on the plastic dish substrate. Scale bar: 5 μm; B: High-magnification scanning electron microscopy images of the surface of sinusoidal endothelial cells cultured on plastic dishes. Fenestrae could not be detected on the surface of endothelial cells. Only small pits are seen (arrow). Scale bar: 1 μm; C: Low-magnification scanning electron microscopic view of the surface of sinusoidal endothelial cells cocultured in the RFB. Fenestrated pores could be observed (arrow). Scale bar: 5 μm; D: High-magnification scanning electron microscopic view of the surface of sinusoidal endothelial cells cocultured in the RFB. Pores have a diameter of 100 - 200 nm. Scale bar: 1 μm.
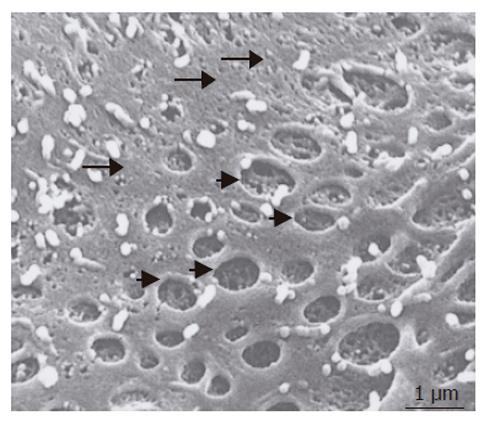
Figure 6 Scanning electron micrographs of the surface of swinholide A - treated SEC cells in the RFB culture system.
Large open pores have a fenestra-like appearance (short arrow). Small pores were detectable in the nonfenestrated area (long arrow). Scale bar: 1 μm.
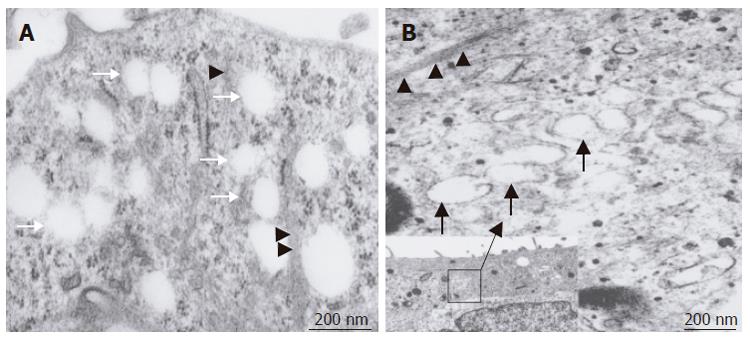
Figure 7 Transmission electron micrographs of sectioned SEC cells after swinholide A - treatment; A: Numerous open pores or fenestrae in the cytoplasm (arrow).
Fine cytoskeletal elements showing a close spatial relationship with these pores (arrowhead). Scale bar: 200 nm; B: VVO could be observed in SEC cells (arrows) in response to stress or actin fibers (arrowheads). Scale bar: 200 nm. Inset shows the overall composition of the cells. Scale bar: 1 μm.
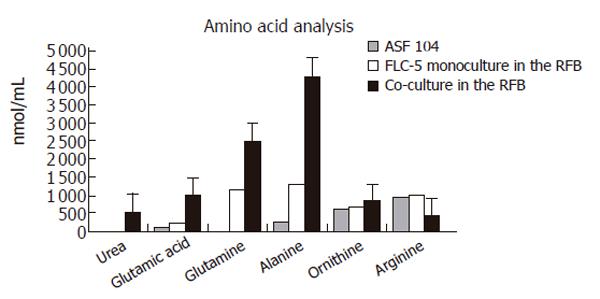
Figure 8 Amino acid and urea analysis in supernatants.
Urea was detectable only in coculture, at 523 nmol/ml. ASF 104 designates culture medium. Mean value ± SD.
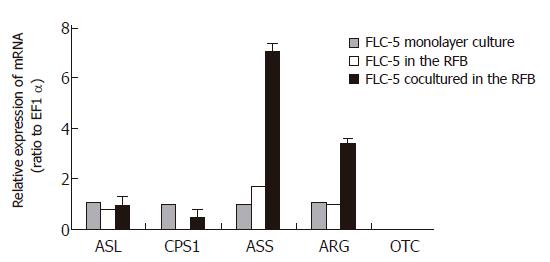
Figure 9 Comparison of expressions of CPS1, OTC, ASS, ASL, and ARG mRNA in FLC-5 incubated under different conditions as assessed by TaqMan 1-step RT-PCR.
The mRNA expression of each enzyme in different conditions is relative to that in monolayer cultures. Mean value ± SD.
Figure 10 Expression of mRNA for albumin (A), HNF-4 (B) and HNF-1 (C) as transcription regulation factors in each condition.
Messenger RNA expression for these three proteins decreased in cocultured FLC-5 in the RFB compared with FLC-5 monocultures in the RFB and FLC-5 cultured in a monolayer. Mean value ± SD. The ratio of mRNA for each protein versus GAPDH is shown. Differences with respect to each condition were statistically significant (bP < 0.01) according to Student’s t-test.
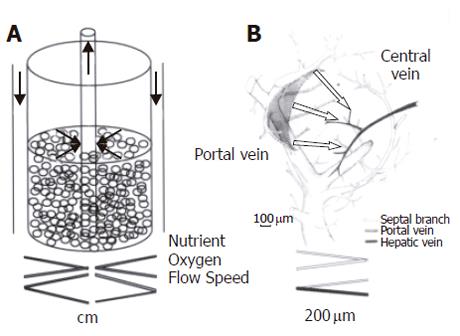
Figure 11 RFB and intact organ.
A: In the RFB system, culture medium flows from outside the column toward the center of the reactor. Medium flows faster at the center than at the periphery. Biases in distribution of oxygen and nutrition at inflow and outflow are minimized. B: In the hepatic lobe, blood flows from the portal vein to central vein. The RFB system is similar to the organization of the hepatic primary lobe[31]. Figure 11B is reproduced from Figure 9 in reference 31.
- Citation: Saito M, Matsuura T, Masaki T, Maehashi H, Shimizu K, Hataba Y, Iwahori T, Suzuki T, Braet F. Reconstruction of liver organoid using a bioreactor. World J Gastroenterol 2006; 12(12): 1881-1888
- URL: https://www.wjgnet.com/1007-9327/full/v12/i12/1881.htm
- DOI: https://dx.doi.org/10.3748/wjg.v12.i12.1881


