Copyright
©2005 Baishideng Publishing Group Inc.
World J Gastroenterol. Feb 14, 2005; 11(6): 810-816
Published online Feb 14, 2005. doi: 10.3748/wjg.v11.i6.810
Published online Feb 14, 2005. doi: 10.3748/wjg.v11.i6.810
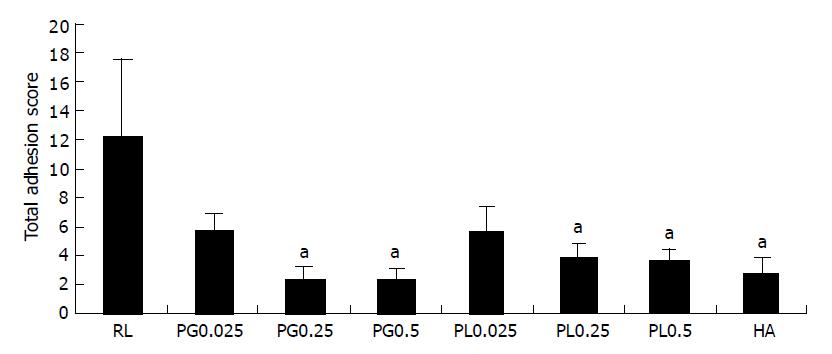
Figure 1 Total adhesion score of intraperitoneal adhesion in each group (in all rats).
The animals were killed one week after the first postoperative day. The abdomen was opened for complete exploration. Rats treated with 0.25 or 0.5% polysaccharides solutions from both PG and PL showed a significantly lower total adhesion score compared with RL group (aP<0.05 vs RL group).
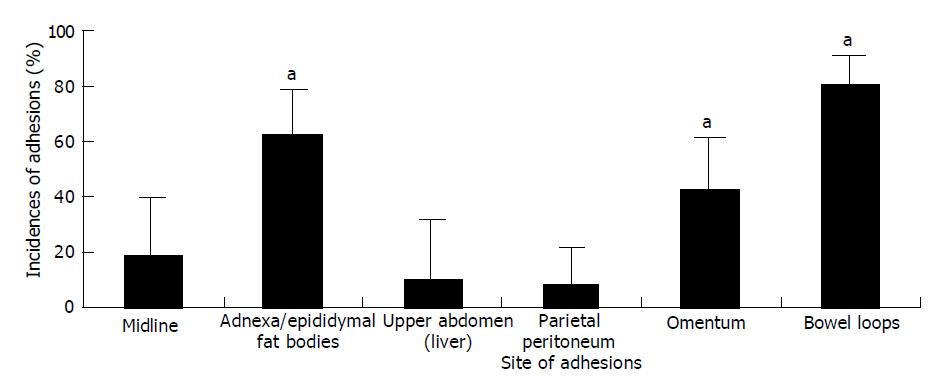
Figure 2 The site of the intraperitoneal adhesions (in all rats).
After the sacrifice, sites of adhesions were observed in the midline, adnexa/epididymal fat bodies, the upper abdomen (liver), the parietal peritoneum, the omentum, and between the bowel loops. Most of the adhesions were found between the bowel loops, adnexa/epididymal fat bodies, and the omentum compared with other sites (aP<0.05).
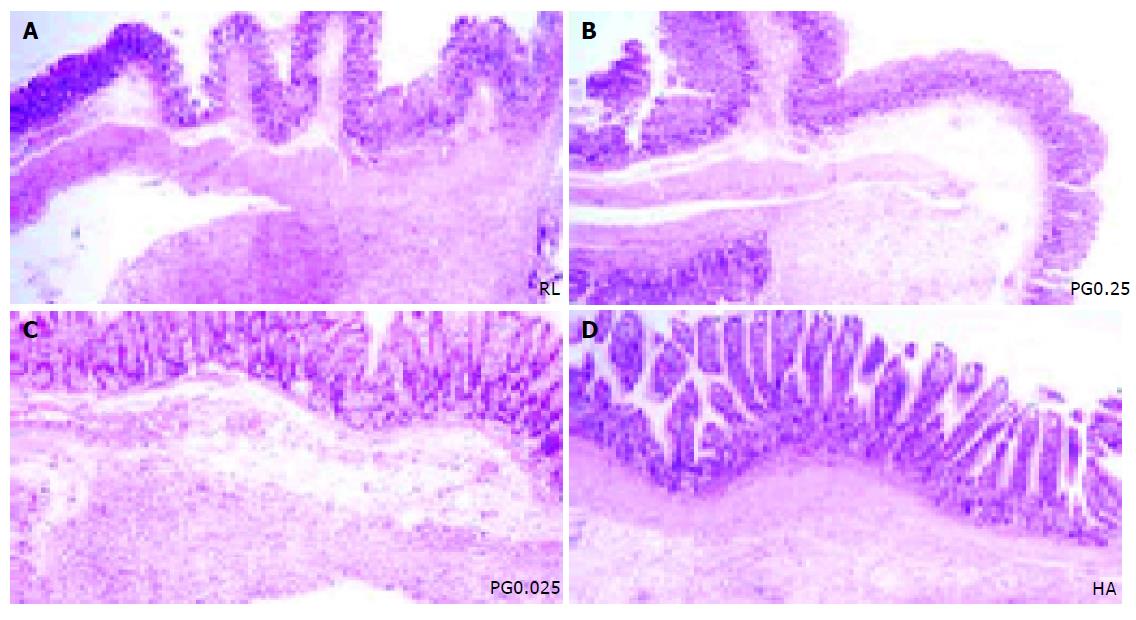
Figure 3 Evaluation of inflammatory reaction from formalin-fixed, paraffin-embedded section of cecal tissues.
Compare the extent of mesenteric inflammatory reaction among (A). RL, (B). PG0.25, (C). PG0.025, and (D). HA (×40). Note markedly reduced inflammatory reaction in PG0.25 treated groups (n = 6 in each group).
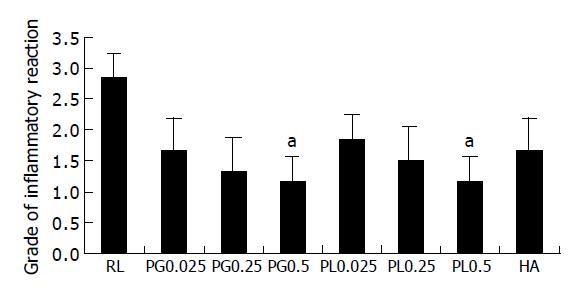
Figure 4 The grade of inflammatory reaction in each group (n = 6 per each group).
The grade of inflammatory response for the PG0.5 and PL0.5 groups was significantly lower than the grade for the RL (aP<0.05 vs RL group).
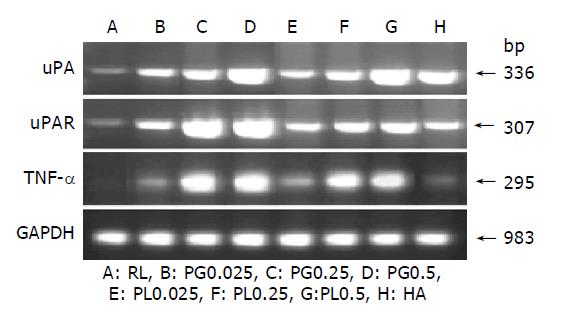
Figure 5 TNF-α, uPA and uPAR mRNA expression in each group (n = 6 per each group).
The TNF-α mRNA was highly expressed, as compared to treatment with RL in PG0.25, 0.5, PL0.25, and 0.5 groups. The uPA gene expression was greatly upregulated by increasing concentration of polysaccharides in the PG and PL treatment groups. The uPAR mRNA was expressed at the highest levels by the treatment with PG0.25 and 0.5. The GAPDH transcript levels among all groups were the same.
-
Citation: Bae JS, Jang KH, Jin HK. Comparison of intraperitoneal anti-adhesive polysaccharides derived from
Phellinus mushrooms in a rat peritonitis model. World J Gastroenterol 2005; 11(6): 810-816 - URL: https://www.wjgnet.com/1007-9327/full/v11/i6/810.htm
- DOI: https://dx.doi.org/10.3748/wjg.v11.i6.810


