Copyright
©The Author(s) 2005.
World J Gastroenterol. Oct 7, 2005; 11(37): 5834-5839
Published online Oct 7, 2005. doi: 10.3748/wjg.v11.i37.5834
Published online Oct 7, 2005. doi: 10.3748/wjg.v11.i37.5834
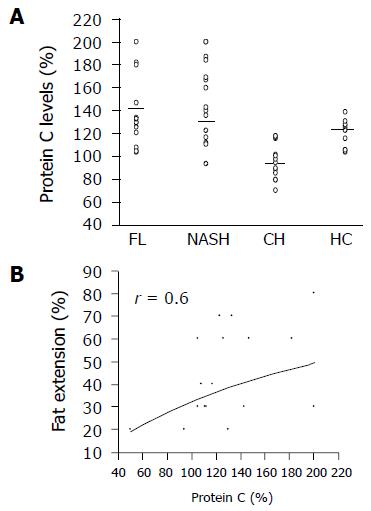
Figure 1 A: Protein C levels (normal 70-130%) in all study population (- median levels).
B: Correlation between fat extension and protein C levels (r = 0.6, P < 0.001).
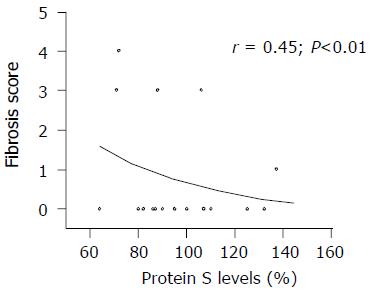
Figure 2 Correlation between fibrotic score and protein S levels in patients with NAFLD (r = 0.
45, P < 0.01).
- Citation: Assy N, Bekirov I, Mejritsky Y, Solomon L, Szvalb S, Hussein O. Association between thrombotic risk factors and extent of fibrosis in patients with non-alcoholic fatty liver diseases. World J Gastroenterol 2005; 11(37): 5834-5839
- URL: https://www.wjgnet.com/1007-9327/full/v11/i37/5834.htm
- DOI: https://dx.doi.org/10.3748/wjg.v11.i37.5834


