Copyright
©The Author(s) 2005.
World J Gastroenterol. Oct 7, 2005; 11(37): 5782-5786
Published online Oct 7, 2005. doi: 10.3748/wjg.v11.i37.5782
Published online Oct 7, 2005. doi: 10.3748/wjg.v11.i37.5782
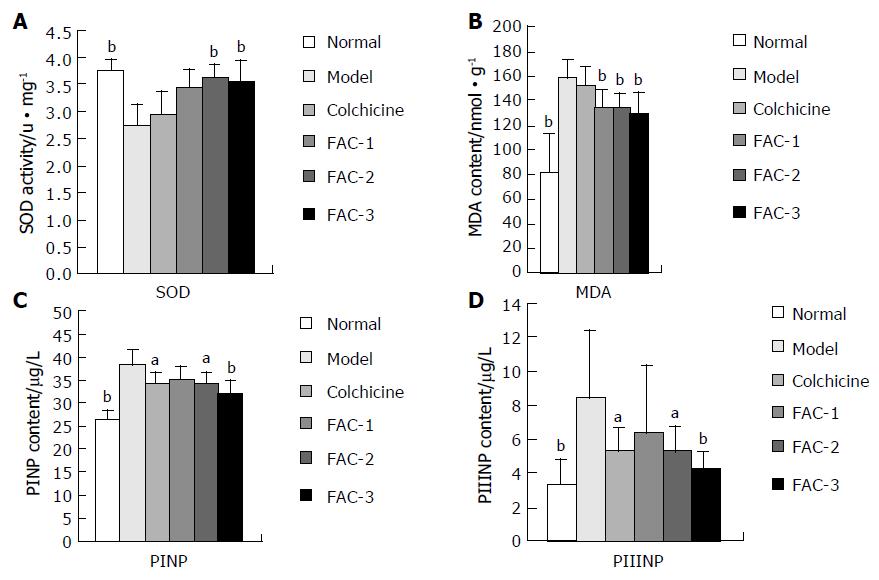
Figure 1 Effects of ACF on SOD activity and MDA content in rat liver tissue (A) and on PINP and PIIINP contents in rats serum (B).
aP < 0.05, bP < 0.01 vs model group.
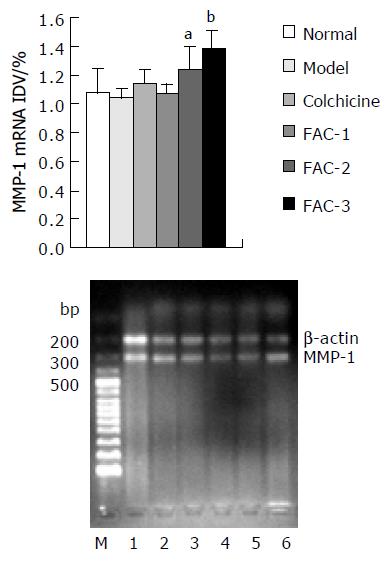
Figure 2 Analysis of MMP-1 mRNA expression in rat hepatic tissue.
M: molecular weight markers (bp); lane 1: normal group; lane 2: model group; lane 3: colchicine group; lane 4: ACF-1 group; lane 5: ACF-2 group; lane 6: ACF-3 group; n = 4.aP < 0.05, bP < 0.01 vs model group.
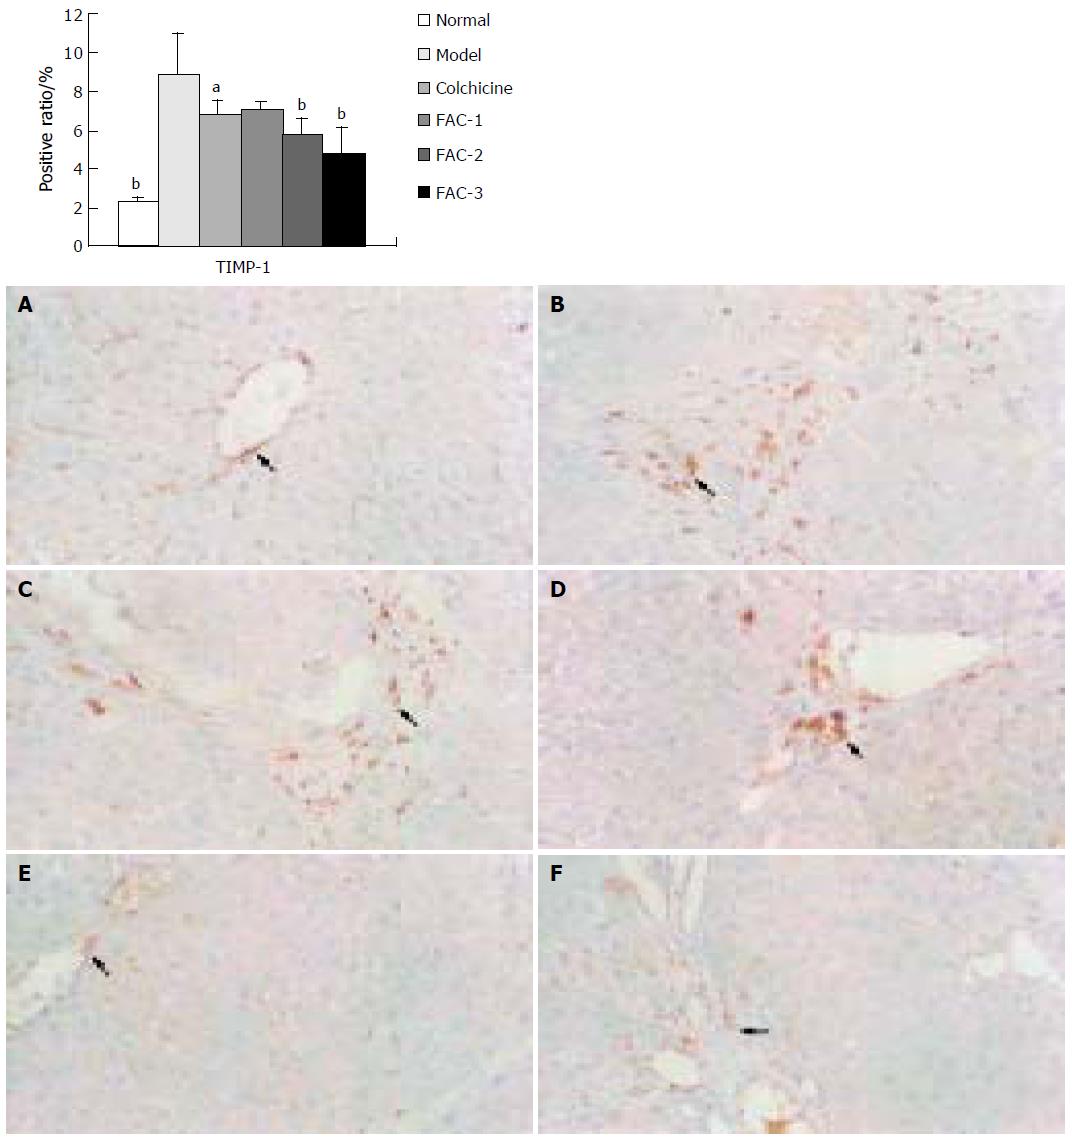
Figure 3 Immunohistochemical expression of TIMP-1 protein in rat hepatic tissue.
(1) The positive ratio detected by Jieda 501 image-analysis system was used as the total protein expression. (2) TIMP-1 is shown as yellow grains in hepatic tissue (immunohistochemistry, ×200). A: normal group; B: model group; C: colchicine group; D: ACF-1 group; E: ACF-2 group; F: ACF-1 group; n = 5. aP < 0.05, bP < 0.01 vs model group.
-
Citation: Liu CY, Gu ZL, Zhou WX, Guo CY. Effect of
Astragalus complanatus flavonoid on anti-liver fibrosis in rats. World J Gastroenterol 2005; 11(37): 5782-5786 - URL: https://www.wjgnet.com/1007-9327/full/v11/i37/5782.htm
- DOI: https://dx.doi.org/10.3748/wjg.v11.i37.5782


