Copyright
©The Author(s) 2005.
World J Gastroenterol. Aug 21, 2005; 11(31): 4895-4898
Published online Aug 21, 2005. doi: 10.3748/wjg.v11.i31.4895
Published online Aug 21, 2005. doi: 10.3748/wjg.v11.i31.4895
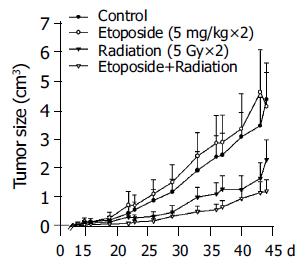
Figure 1 Tumor size in BALB/c mice implanted with CT26 colorectal adenocarcinoma cells.
(●) control group, saline only; (○) etoposide group, 5 mg/kg×2; (▼) RT group, 5 Gy×2; (▽) combination therapy group (etoposide plus RT).
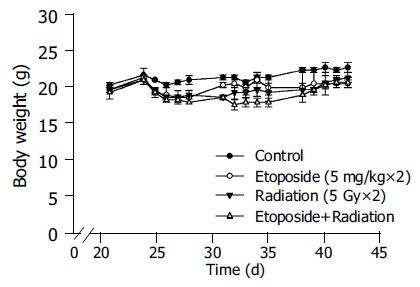
Figure 2 Changes in body weight of BALB/c mice implanted with CT26 colorectal adenocarcinoma cells.
(●) control group, saline only; (○) etoposide group, 5 mg/kg×2; (▼) RT group, 5 Gy×2; (△) combination therapy group (etoposide plus RT).
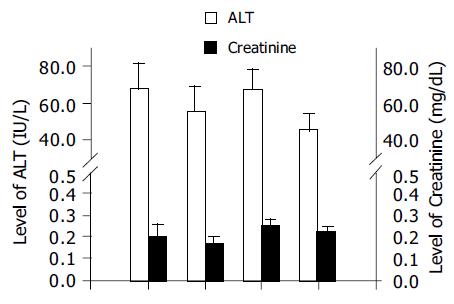
Figure 3 Plasma ALT and creatinine levels after killing of BALB/c mice implanted with CT26 colorectal adenocarcinoma cells.
From left to right are: control group, etoposide group, RT group, and combination therapy group.
Figure 4 Serial changes in leukocyte counts of BALB/c mice implanted with CT26 colorectal adenocarcinoma cells.
(●) control group, saline only; (○) etoposide group, 5 mg/kg×2; (▼) RT group, 5 Gy×2; (△) combination therapy group (etoposide plus RT).
- Citation: Liu CY, Liao HF, Wang TE, Lin SC, Shih SC, Chang WH, Yang YC, Lin CC, Chen YJ. Etoposide sensitizes CT26 colorectal adenocarcinoma to radiation therapy in BALB/c mice. World J Gastroenterol 2005; 11(31): 4895-4898
- URL: https://www.wjgnet.com/1007-9327/full/v11/i31/4895.htm
- DOI: https://dx.doi.org/10.3748/wjg.v11.i31.4895


