Copyright
©The Author(s) 2005.
World J Gastroenterol. Aug 14, 2005; 11(30): 4674-4678
Published online Aug 14, 2005. doi: 10.3748/wjg.v11.i30.4674
Published online Aug 14, 2005. doi: 10.3748/wjg.v11.i30.4674
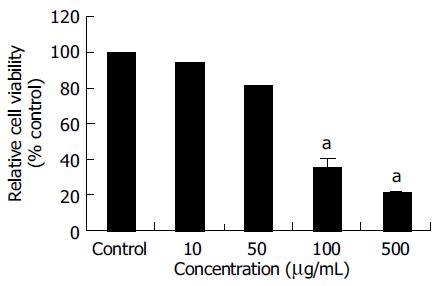
Figure 1 Cytotoxic effects of OPC.
SNU-C4 cells were treated with various concentrations of OPC for 24 h prior to the determination of cellular viability. Results are presented as mean ± SE. aP < 0.05 vs control group.
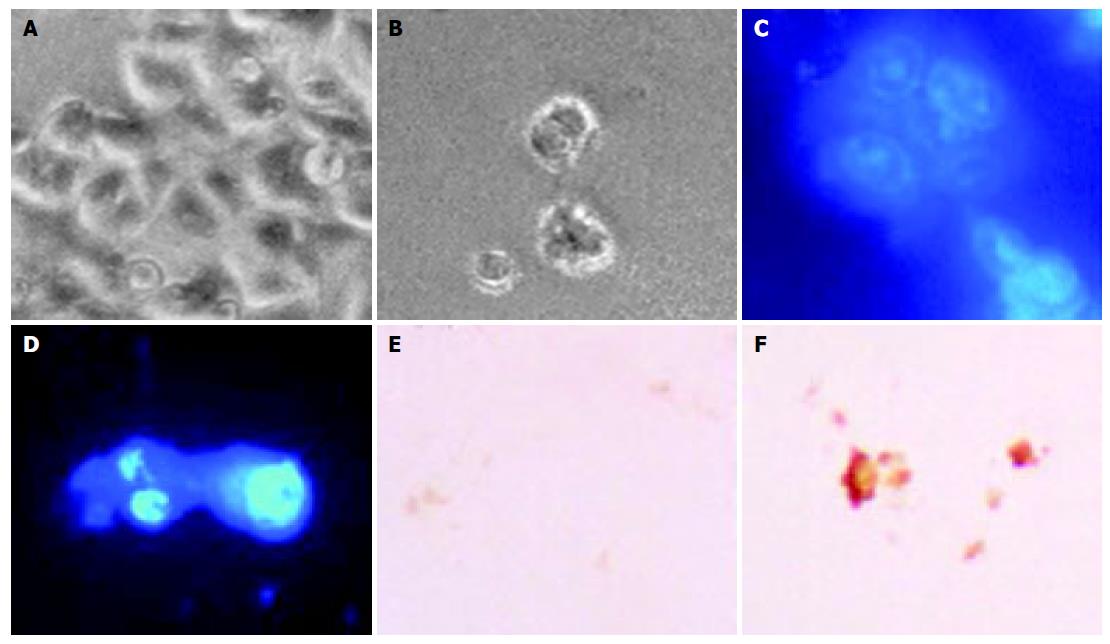
Figure 2 Characterization of OPC-induced cell death in SNU-C4 cells.
Cells were cultured without OPC (A, C and E) or with 100 µg/mL OPC (B, D and F). Morphology (top): phase-contrast microscopy shows cell shrinkage, bubble like bleb in cell membrane and cellular detachment in OPC-treated cultures (B). SNU-C4 cells stained with DAPI staining (D). SNU-C4 cells stained with TUNEL staining (F): Scale bar, 10 µm.
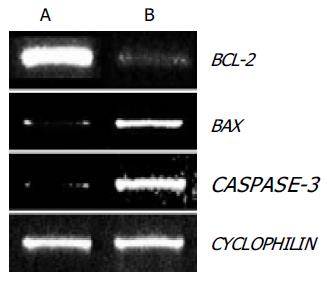
Figure 3 Results of RT-PCR analysis of BCL-2, BAX, and CASPASE-3.
As internal control, CYCLOPHILIN mRNA was also reverse-transcribed and amplified. (A) Control, (B)100 µg/mL OPC treated group.
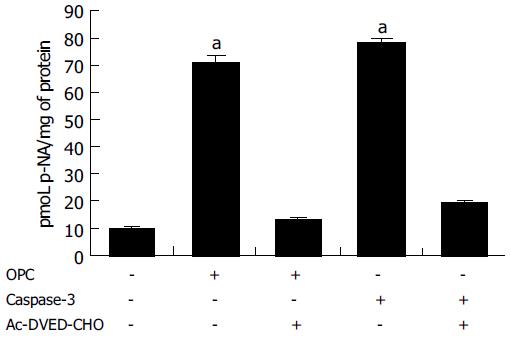
Figure 4 Result of caspase-3 enzyme activity assay.
The rate of Ac-DEVD-pNA cleavage was measured at 405 nm. OPC was used as concentration of 100 µg/mL. Caspase-3 was a positive control and Ac-DEVD-CHO was a caspase inhibitor. aP < 0.05 vs control group.
- Citation: Kim YJ, Park HJ, Yoon SH, Kim MJ, Leem KH, Chung JH, Kim HK. Anticancer effects of oligomeric proanthocyanidins on human colorectal cancer cell line, SNU-C4. World J Gastroenterol 2005; 11(30): 4674-4678
- URL: https://www.wjgnet.com/1007-9327/full/v11/i30/4674.htm
- DOI: https://dx.doi.org/10.3748/wjg.v11.i30.4674


