Copyright
©The Author(s) 2005.
World J Gastroenterol. Aug 7, 2005; 11(29): 4560-4565
Published online Aug 7, 2005. doi: 10.3748/wjg.v11.i29.4560
Published online Aug 7, 2005. doi: 10.3748/wjg.v11.i29.4560
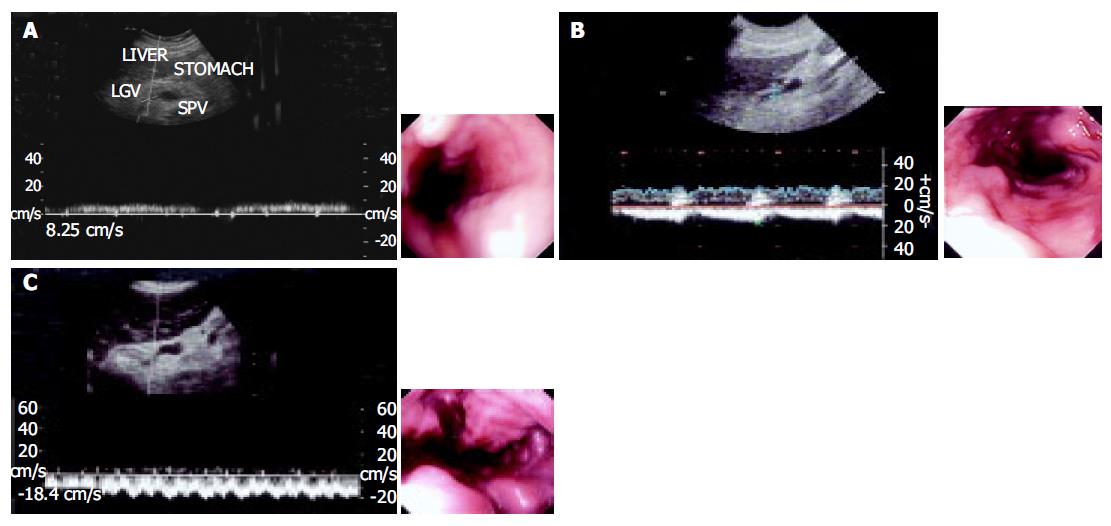
Figure 1 Relationship between hemodynamics of the LGV and the size of esophageal varices.
A: Hepatopetal blood flow in the LGV; B: hepatofugal blood flow in the LGV; C: hepatofugal blood flow in the LGV.
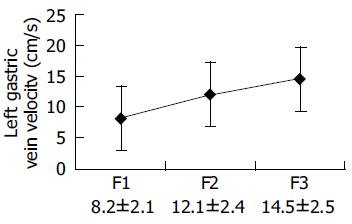
Figure 2 Hepatofugal flow velocity in LGV in relation to the size of esophageal varices.
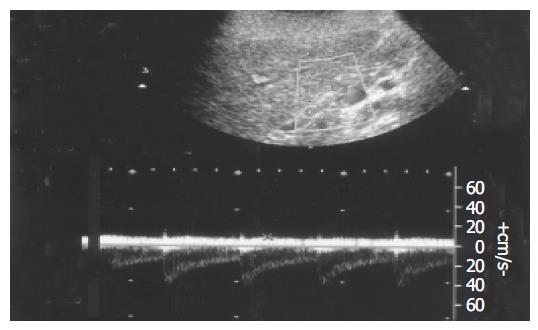
Figure 3 Hepatopetal blood flow in the LGV of normal subjects.
Figure 4 Change in flow direction in the LGV.
A: Hepatopetal blood flow in the LGV before ingestion of glucose; B: changes of flow direction from hepatopetal to hepatofugal after ingestion of glucose.
Figure 5 Doppler sonograms in the LGV with hepatofugal blood flow before (A) and after (B) ingestion of glucose in a patient with a significant response to glucose.
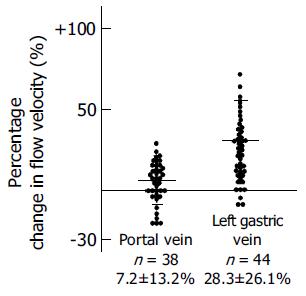
Figure 6 Changes in blood flow in the PV and LGV of patients with hepatofugal blood flow before and after ingestion of glucose.
- Citation: Li FH, Hao J, Xia JG, Li HL, Fang H. Hemodynamic analysis of esophageal varices in patients with liver cirrhosis using color Doppler ultrasound. World J Gastroenterol 2005; 11(29): 4560-4565
- URL: https://www.wjgnet.com/1007-9327/full/v11/i29/4560.htm
- DOI: https://dx.doi.org/10.3748/wjg.v11.i29.4560


