Copyright
©The Author(s) 2005.
World J Gastroenterol. Jul 28, 2005; 11(28): 4367-4374
Published online Jul 28, 2005. doi: 10.3748/wjg.v11.i28.4367
Published online Jul 28, 2005. doi: 10.3748/wjg.v11.i28.4367
Math 1 Math(A1).
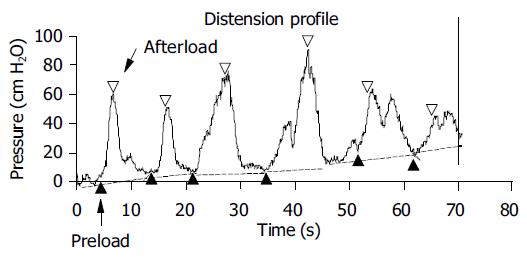
Figure 1 (PDF) Raw data in a typical subject showing the change in pressure during bag-distension-induced contractions.
The change in tension during maximal distension-induced contractions (afterload tension) was computed at the open triangles and expressed as function of the radius immediately before the contractions marked with solid triangles (preload radius). The radius was calculated on the basis of the CSA measured simultaneously. For details regarding the calculations see Methods section.
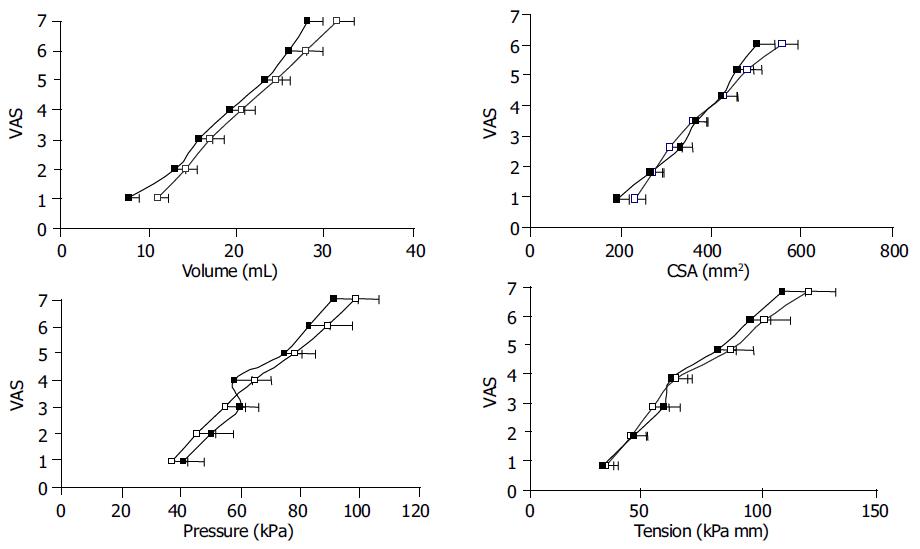
Figure 2 (PDF) Sensory response to bag distension of the distal esophagus expressed as functions of the volume, CSA, pressure and tension.
The curves were drawn before (□) and after (■) perfusion of the distal esophagus with acid. The sensory response increased after acid perfusion when expressed as a function of the volume.
Figure 3 (PDF) Tension during bag-distension-induced contractions (the afterload tension) plotted as functions of the radius immediately before the contractions (the preload radius) as shown in Figure 1.
Five to eight datasets were computed during the distension for 10 representative subjects. Data calculated at painful sensations were all above preload radii of 11.5 mm and are shown as open markings.
Figure 4 (PDF) Plots of the total tonic (top), the passive (dotted) and the active (thin) tonic tensions as functions of radius before and after acid infusion.
For explanations see text. Acid did not change the curve shapes. Hence, esophageal muscle tone was not affected by the acid infusion.
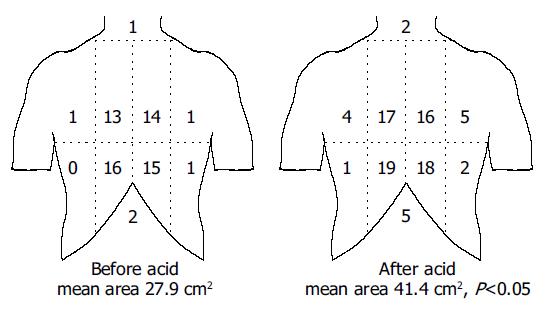
Figure 5 (PDF) A schematic illustration of the referred pain areas drawn by the subjects following mechanical stimuli of the esophagus before and after perfusion with acid.
The stimuli were given with an intensity corresponding to moderate pain. The chest was divided into eight areas by a horizontal line 5 cm above the xiphoid process, a vertical midline and two vertical lines 5 cm lateral to the midline. The numbers on the figure refer to the number of subjects reporting referred pain to that particular region of the chest. The referred pain area increased following the sensitization with acid.
- Citation: Drewes AM, Reddy H, Staahl C, Pedersen J, Funch-Jensen P, Arendt-Nielsen L, Gregersen H. Sensory-motor responses to mechanical stimulation of the esophagus after sensitization with acid. World J Gastroenterol 2005; 11(28): 4367-4374
- URL: https://www.wjgnet.com/1007-9327/full/v11/i28/4367.htm
- DOI: https://dx.doi.org/10.3748/wjg.v11.i28.4367


