Copyright
©The Author(s) 2005.
World J Gastroenterol. Jul 28, 2005; 11(28): 4367-4374
Published online Jul 28, 2005. doi: 10.3748/wjg.v11.i28.4367
Published online Jul 28, 2005. doi: 10.3748/wjg.v11.i28.4367
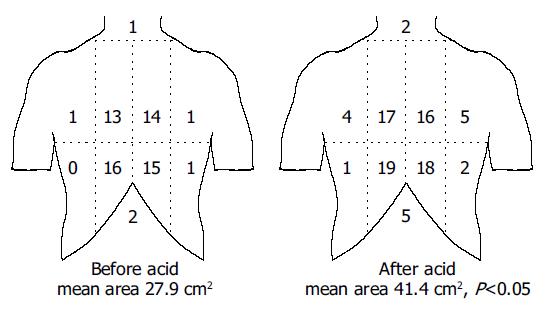
Figure 5 (PDF) A schematic illustration of the referred pain areas drawn by the subjects following mechanical stimuli of the esophagus before and after perfusion with acid.
The stimuli were given with an intensity corresponding to moderate pain. The chest was divided into eight areas by a horizontal line 5 cm above the xiphoid process, a vertical midline and two vertical lines 5 cm lateral to the midline. The numbers on the figure refer to the number of subjects reporting referred pain to that particular region of the chest. The referred pain area increased following the sensitization with acid.
- Citation: Drewes AM, Reddy H, Staahl C, Pedersen J, Funch-Jensen P, Arendt-Nielsen L, Gregersen H. Sensory-motor responses to mechanical stimulation of the esophagus after sensitization with acid. World J Gastroenterol 2005; 11(28): 4367-4374
- URL: https://www.wjgnet.com/1007-9327/full/v11/i28/4367.htm
- DOI: https://dx.doi.org/10.3748/wjg.v11.i28.4367


