Copyright
©2005 Baishideng Publishing Group Inc.
World J Gastroenterol. May 21, 2005; 11(19): 2932-2940
Published online May 21, 2005. doi: 10.3748/wjg.v11.i19.2932
Published online May 21, 2005. doi: 10.3748/wjg.v11.i19.2932
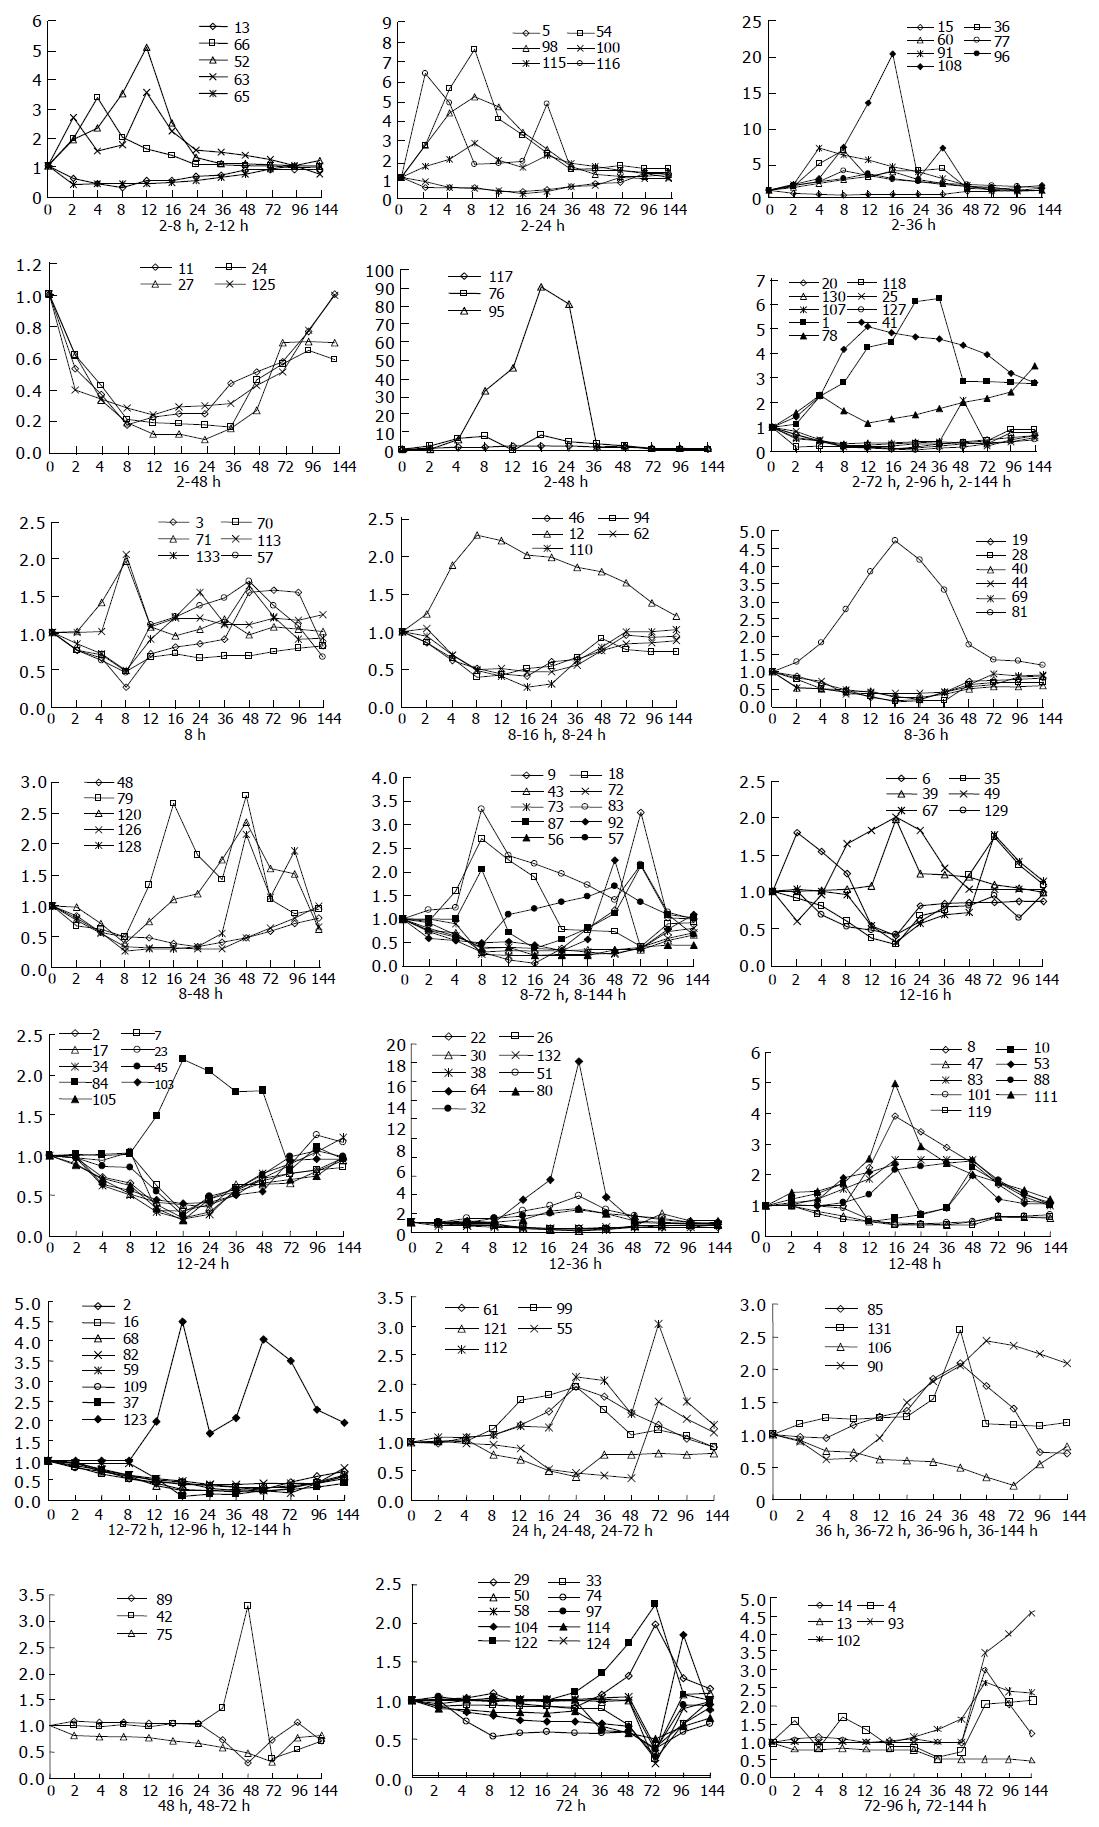
Figure 1 Gene expression differences at different time points after PH.
The 133 elements were categorized into 21 temporal patterns following the induction of suppressed time points.
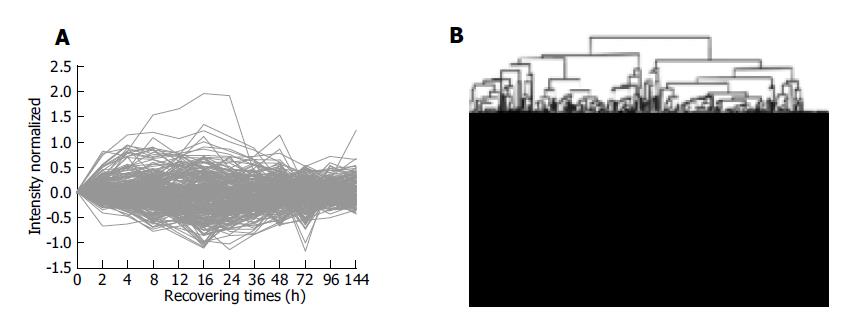
Figure 2 Hierarchical cluster analysis of 300 elements.
A: Cluster of distribution trend. Three hundred elements differing by at least more than twofold intensity at one time point were identified; B: Cluster of hierarchical relativity. A hierarchical cluster of 11 time points showed that 12 and 16 h, 48 and 96 h as well as 72 and 144 h patterns were clustered together as separate groups in major branches.
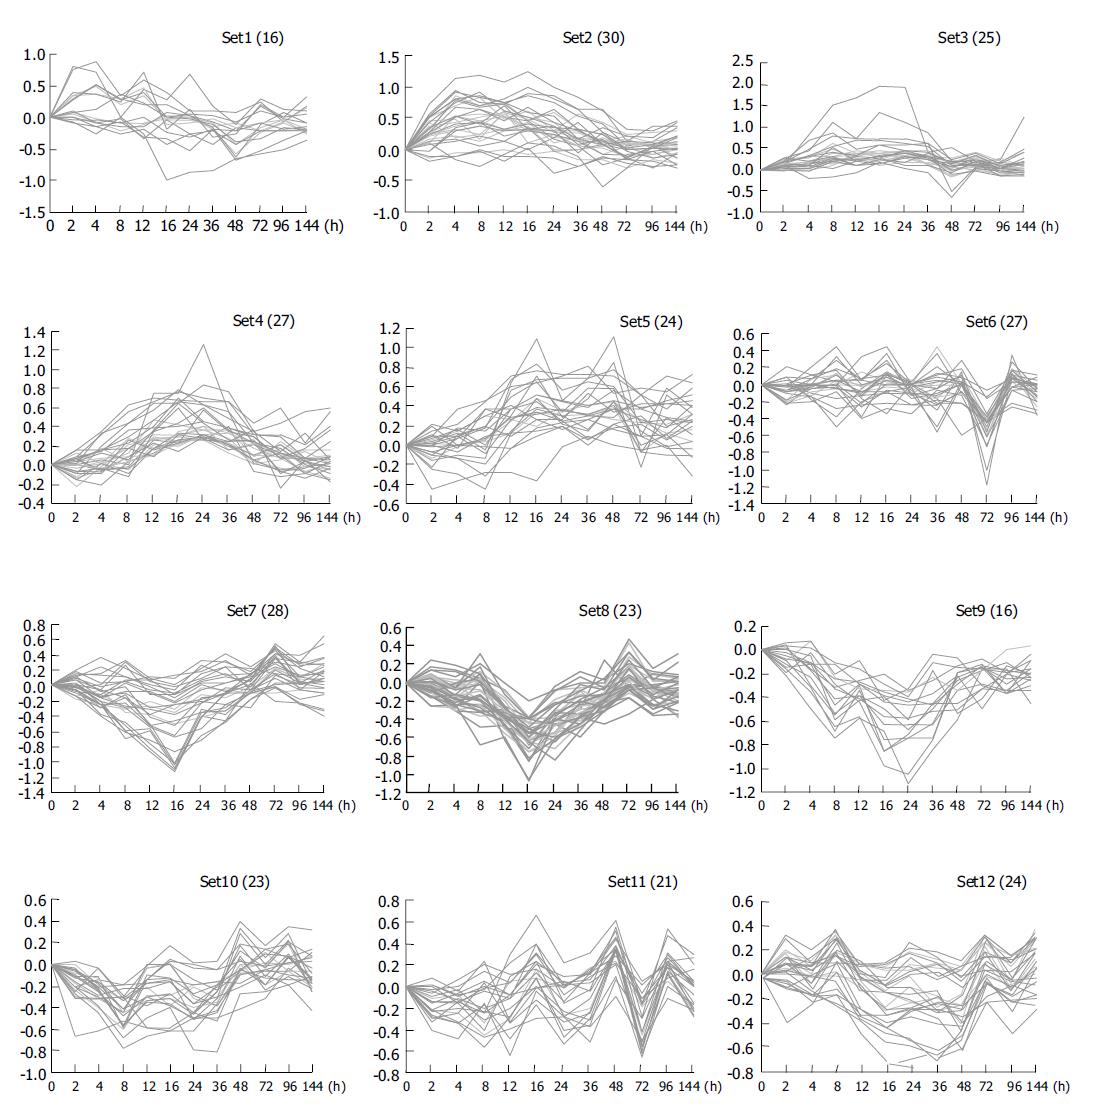
Figure 3 Cluster analysis of differentially expressed genes identified by cDNA microarray-based gene expression profiling.
These genes were classified into 12 clusters by GeneMaths.
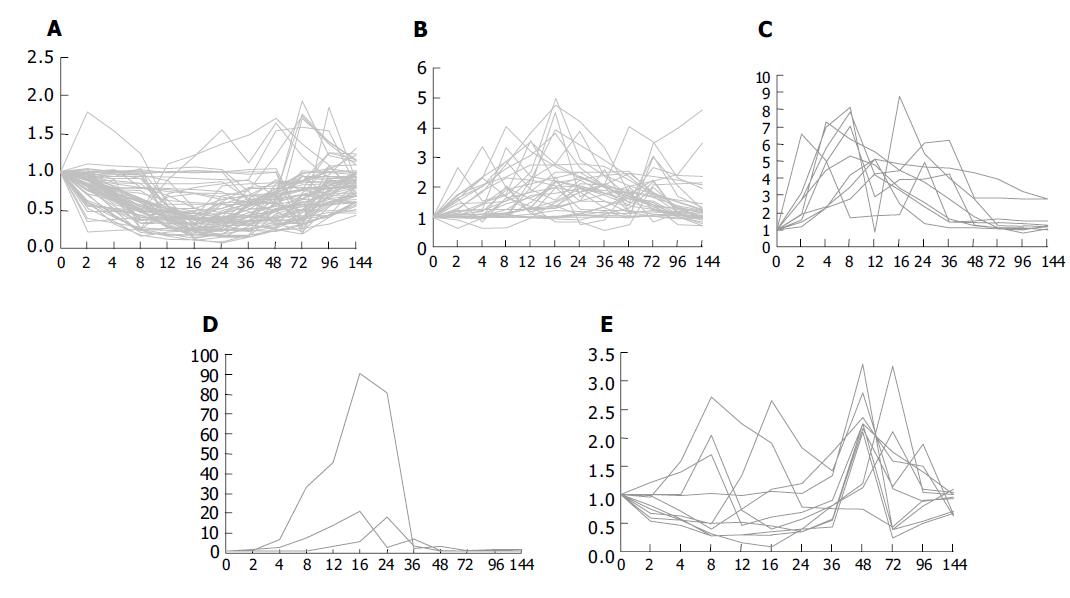
Figure 4 Expression of different genes in LR.
A: Seventy-four downregulated genes; B: thirty-seven upregulated genes whose fold changes were 2-5; C: nine upregulated genes whose fold changes were 5-10; D: three up-regulated genes whose fold changes were above 10; E: ten up- and downregulated genes.
- Citation: Xu CS, Chang CF, Yuan JY, Li WQ, Han HP, Yang KJ, Zhao LF, Li YC, Zhang HY, Rahman S, Zhang JB. Expressed genes in regenerating rat liver after partial hepatectomy. World J Gastroenterol 2005; 11(19): 2932-2940
- URL: https://www.wjgnet.com/1007-9327/full/v11/i19/2932.htm
- DOI: https://dx.doi.org/10.3748/wjg.v11.i19.2932


