Copyright
©The Author(s) 2004.
World J Gastroenterol. May 1, 2004; 10(9): 1321-1324
Published online May 1, 2004. doi: 10.3748/wjg.v10.i9.1321
Published online May 1, 2004. doi: 10.3748/wjg.v10.i9.1321
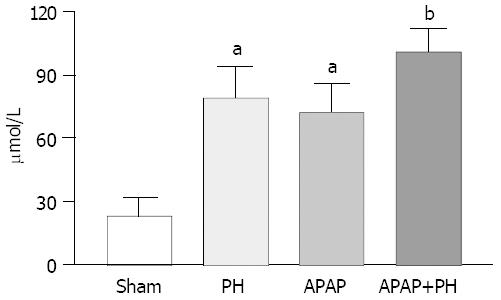
Figure 1 Significantly increased ammonia plasma levels in all groups of rats aP<0.
05 and bP<0.01 when compared with sham group.
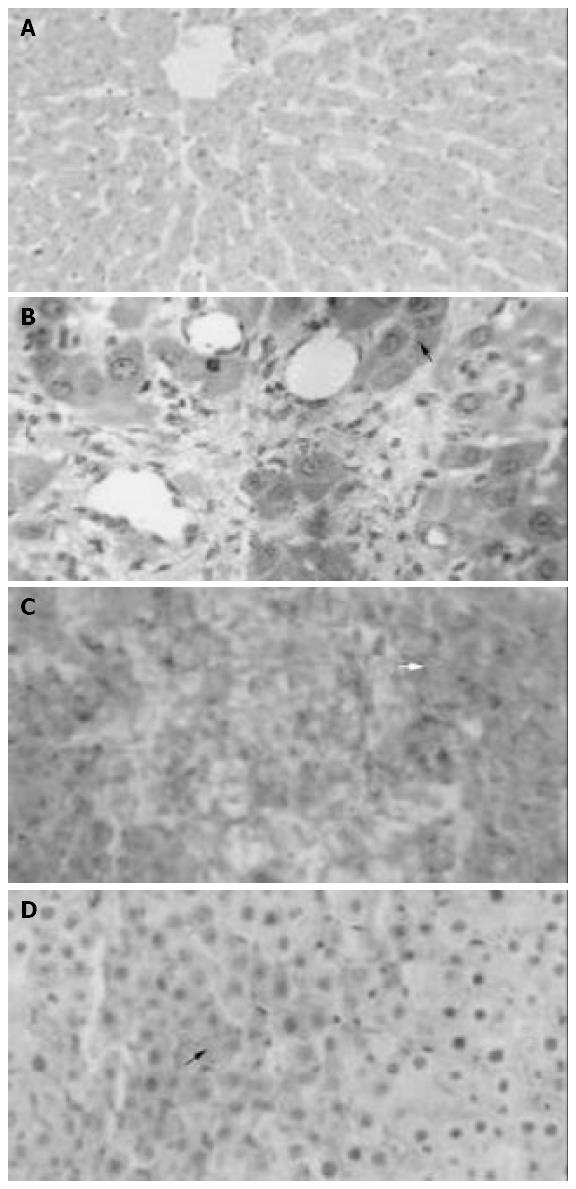
Figure 2 Liver Microscopy.
A: Shows a normal liver histology corresponding to a rat in sham group (HE, 100 ×); B: Minimal focal necrosis in group II (HE, asterisk, 500 ×); C: Diffuse hem-orrhagic necrosis in group III (HE, arrows, 400 ×); D: Focal hem-orrhagic confluent necrosis in group IV (HE, asterisk, 400 ×).
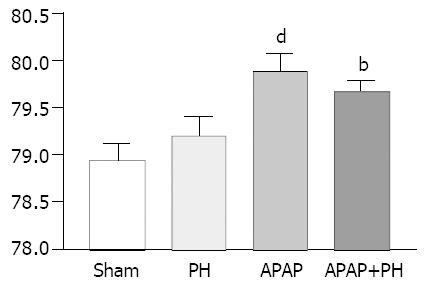
Figure 3 Significantly increased brain water content in groups III and IV dP < 0.
01, bP < 0.001 when compared with sham group.
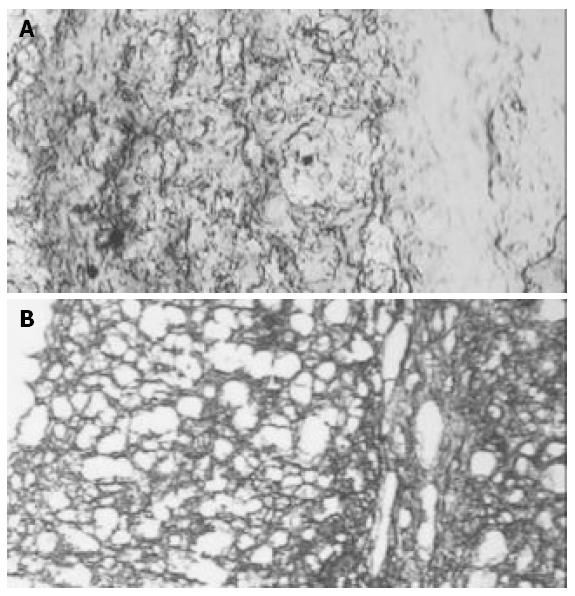
Figure 4 Trypan blue and BBB.
A: Trypan blue dye in hippocam-pus of a sham rat. No breakdown of BBB was observed. Trypan blue was only positive in vascular space (100 ×); B: Trypan blue dye diffusion due to the breakdown of BBB as an example of what was observed in hippocampus in groups II, III and IV (100 ×).
- Citation: Scorticati C, Prestifilippo JP, Eizayaga FX, Castro JL, Romay S, Fernández MA, Lemberg A, Perazzo JC. Hyperammonemia, brain edema and blood-brain barrier alterations in prehepatic portal hypertensive rats and paracetamol intoxication. World J Gastroenterol 2004; 10(9): 1321-1324
- URL: https://www.wjgnet.com/1007-9327/full/v10/i9/1321.htm
- DOI: https://dx.doi.org/10.3748/wjg.v10.i9.1321


