Copyright
©The Author(s) 2004.
World J Gastroenterol. Feb 15, 2004; 10(4): 560-566
Published online Feb 15, 2004. doi: 10.3748/wjg.v10.i4.560
Published online Feb 15, 2004. doi: 10.3748/wjg.v10.i4.560
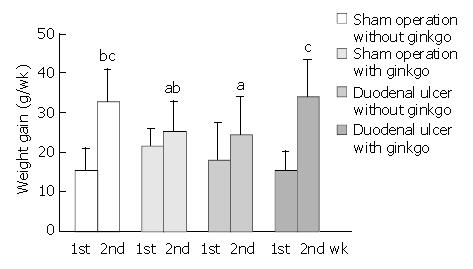
Figure 1 Weight gain of rats during the first and second weeks.
Data are mean ± SD (n = 8). Values not sharing the same letter differ significantly (P < 0.05) within the same week by Fisher’s least significant difference test.
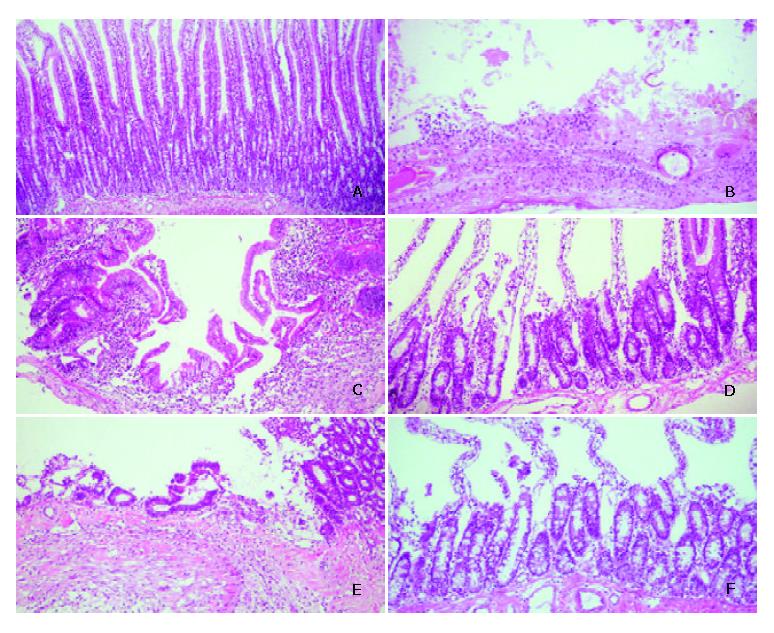
Figure 2 Representative micrographs of duodenal mucosa stained by haematoxylin and eosin.
A: sham operation rats on day 1 before treatment (× 200), B: duodenal ulcer rats on day 1 before treatment (× 100), C: duodenal ulcer rats without ginkgo after 7 d treatment (× 100), D: duodenal ulcer rats with ginkgo after 7 d treatment (× 200), E: duodenal ulcer rats without ginkgo after 14 d treatment (× 100), and F: duodenal ulcer rats with ginkgo after 14 d treatment (× 200).
Figure 3 Representative micrographs (× 400) stained by anti-bromodeoxyuridine (anti-BrdU) immunohistochemical method (A), and quantitation of the number of total (B) and BrdU-labeled (C) cells in the proliferation zone from the duodenal mucosa of the rats.
Data are mean ± SD (n = 8). The nuclei of BrdU-labeled cells were stained in brown. The number of total and BrdU-labeled cells was obtained from three individual crypts for each rat. Values not sharing the same letter differ significantly (P < 0.05) within the same day by Fisher’s least significant difference test.
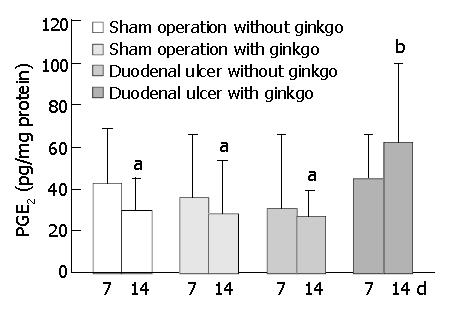
Figure 4 Concentration of prostaglandin E2 (PGE2) in duode-nal mucosa of the rats during experimental period.
Data are mean ± SD (n = 8). Values not sharing the same letter differ sig-nificantly (P < 0.05) within the same day by Fisher’s least sig-nificant difference test.
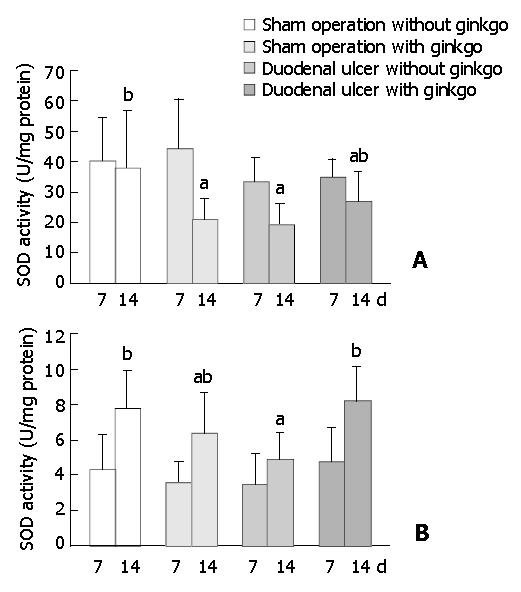
Figure 5 Activity of superoxide dismutase (SOD) in duodenal mucosa (A) and erythrocytes (B) of the rats during experimen-tal period.
Data are mean ± SD (n = 8). Values not sharing the same letter differ significantly (P < 0.05) within the same day by Fisher’s least significant difference test.
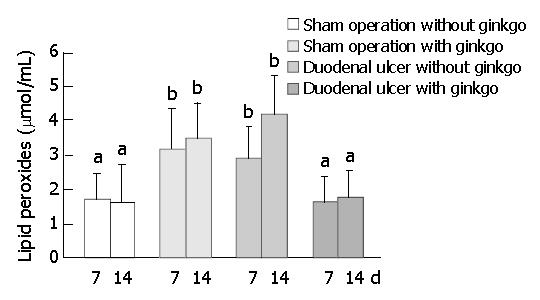
Figure 6 Concentration of lipid peroxides (malondialdehyde and 4-hydroxy-2(E)-nonenal) in plasma of the rats during experimental period.
Data are mean ± SD (n = 8). Values not shar-ing the same letter differ significantly (P < 0.05) within the same day by Fisher’s least significant difference test.
- Citation: Chao JCJ, Hung HC, Chen SH, Fang CL. Effects of Ginkgo biloba extract on cytoprotective factors in rats with duodenal ulcer. World J Gastroenterol 2004; 10(4): 560-566
- URL: https://www.wjgnet.com/1007-9327/full/v10/i4/560.htm
- DOI: https://dx.doi.org/10.3748/wjg.v10.i4.560


