Copyright
©The Author(s) 2004.
World J Gastroenterol. Nov 1, 2004; 10(21): 3141-3145
Published online Nov 1, 2004. doi: 10.3748/wjg.v10.i21.3141
Published online Nov 1, 2004. doi: 10.3748/wjg.v10.i21.3141
Figure 1 Southern blot analysis of 20 μg of total DNA ex-tracted from transgenic mouse tail tissues of lineages G145R-15 and G145R-18.
Lane 0: Positive control; Lane 1: Lineage G145R-15; Lane 2: Lineage G145R-15; Lane 3: F1 transgenic mice of lineage G145R-15; Lane 4: F1 transgenic mice of lineage G145R-18; Lane 5: Lineage of transgenic mice harbouring pro-totype HBV genome; Lane 6: Non-transgenic mice as negative control. All DNA samples were RNase treated before gel electrophoresis. The filters were hybridized with a digoxigeninlabeled HBV specific DNA probe.
Figure 2 Immunohistochemical analysis of HBsAg and HBcAg in the liver.
A: Presence of cytoplasmic HBsAg in almost all of hepatocytes in immunohistochemical analysis of the liver of an 6-week-old male mouse. Magnification, × 100. B: Cytoplasmic HBcAg in centrilobular region hepatocytes surrounding the central veins. Magnification, × 200. C: Nuclear HBcAg scattering widely throughout the hepatic lobule. Magnification, × 100.
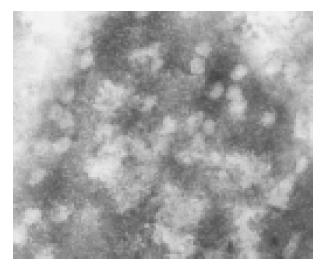
Figure 3 Ultrastructural analysis of HBcAg in the liver.
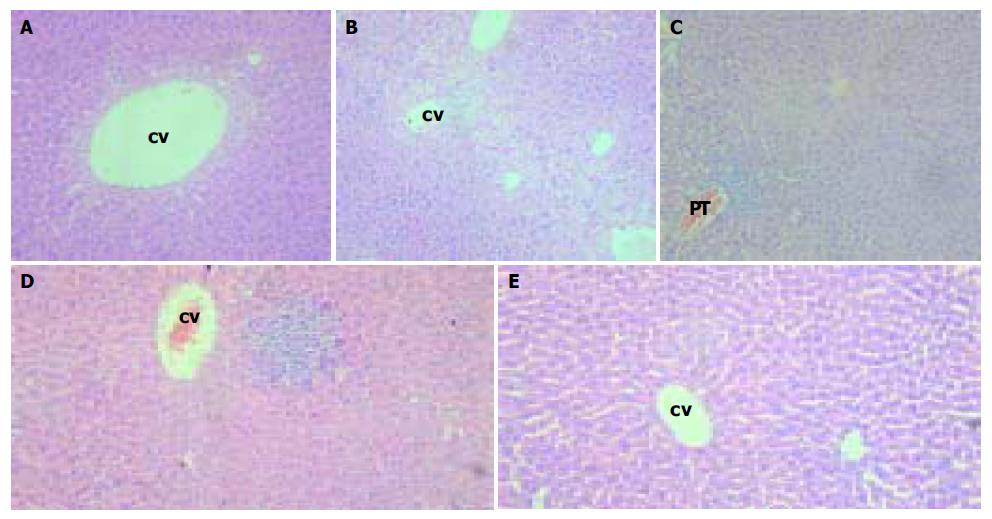
Figure 4 Analysis of pathological changes in the liver of transgenic mice by HE staining.
Magnification × 100. A: Mild swollen hepatocytes around the central veins (CV) in the centrilobular region. B: “Ballooning degeneration” around the central veins or between the two central veins in the liver. C: Predominantly lymphocytic cell infiltrates in portal tract area and hepatic lobules. D: Focal necrosis and predominantly lymphocytic cell infiltrates in hepatic lobule. E: Liver of normal mice.
-
Citation: Ge JH, Zhang LZ, Li JX, Liu H, Liu HM, He J, Yao YC, Yang YJ, Yu HY, Hu YP. Replication and gene expression of mutant hepatitis B virus in a transgenic mouse containing the complete viral genome with mutant
s gene. World J Gastroenterol 2004; 10(21): 3141-3145 - URL: https://www.wjgnet.com/1007-9327/full/v10/i21/3141.htm
- DOI: https://dx.doi.org/10.3748/wjg.v10.i21.3141


