Copyright
©The Author(s) 2004.
World J Gastroenterol. Jul 15, 2004; 10(14): 2130-2133
Published online Jul 15, 2004. doi: 10.3748/wjg.v10.i14.2130
Published online Jul 15, 2004. doi: 10.3748/wjg.v10.i14.2130
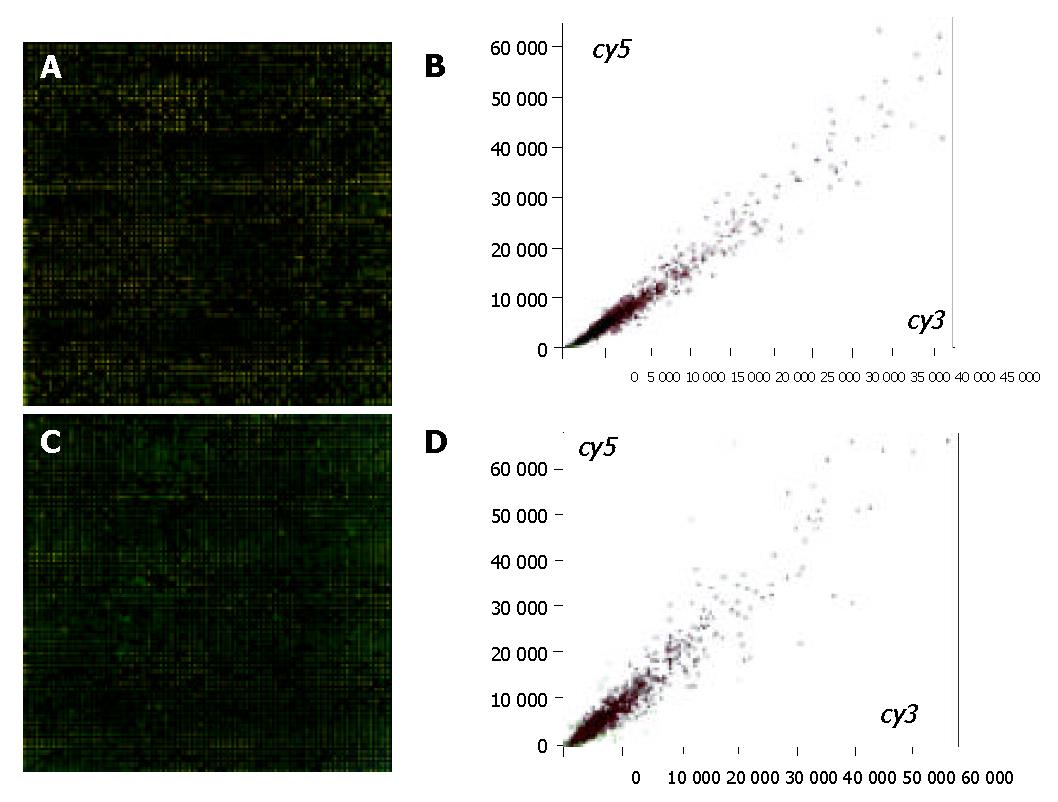
Figure 1 Double-colored fluorescent labels and scattered diagram of signal intensity of differential gene expressions in 15 min ischemic group and normal control group.
Green: Down-regulation, Signal of cy3 is stronger; Red: Up-regulation, signal of cy5 is stronger. A, C: Double-colored fluorescent labels: In 15 min ischemic group and normal control group; B, D: Scatter diagram of signal intensity of differential gene expressions in 15 min ischemia group and normal control group.
- Citation: Lu QP, Cao TJ, Zhang ZY, Liu W. Multiple gene differential expression patterns in human ischemic liver: Safe limit of warm ischemic time. World J Gastroenterol 2004; 10(14): 2130-2133
- URL: https://www.wjgnet.com/1007-9327/full/v10/i14/2130.htm
- DOI: https://dx.doi.org/10.3748/wjg.v10.i14.2130


