Copyright
©The Author(s) 2021.
World J Clin Cases. Jul 26, 2021; 9(21): 6032-6040
Published online Jul 26, 2021. doi: 10.12998/wjcc.v9.i21.6032
Published online Jul 26, 2021. doi: 10.12998/wjcc.v9.i21.6032
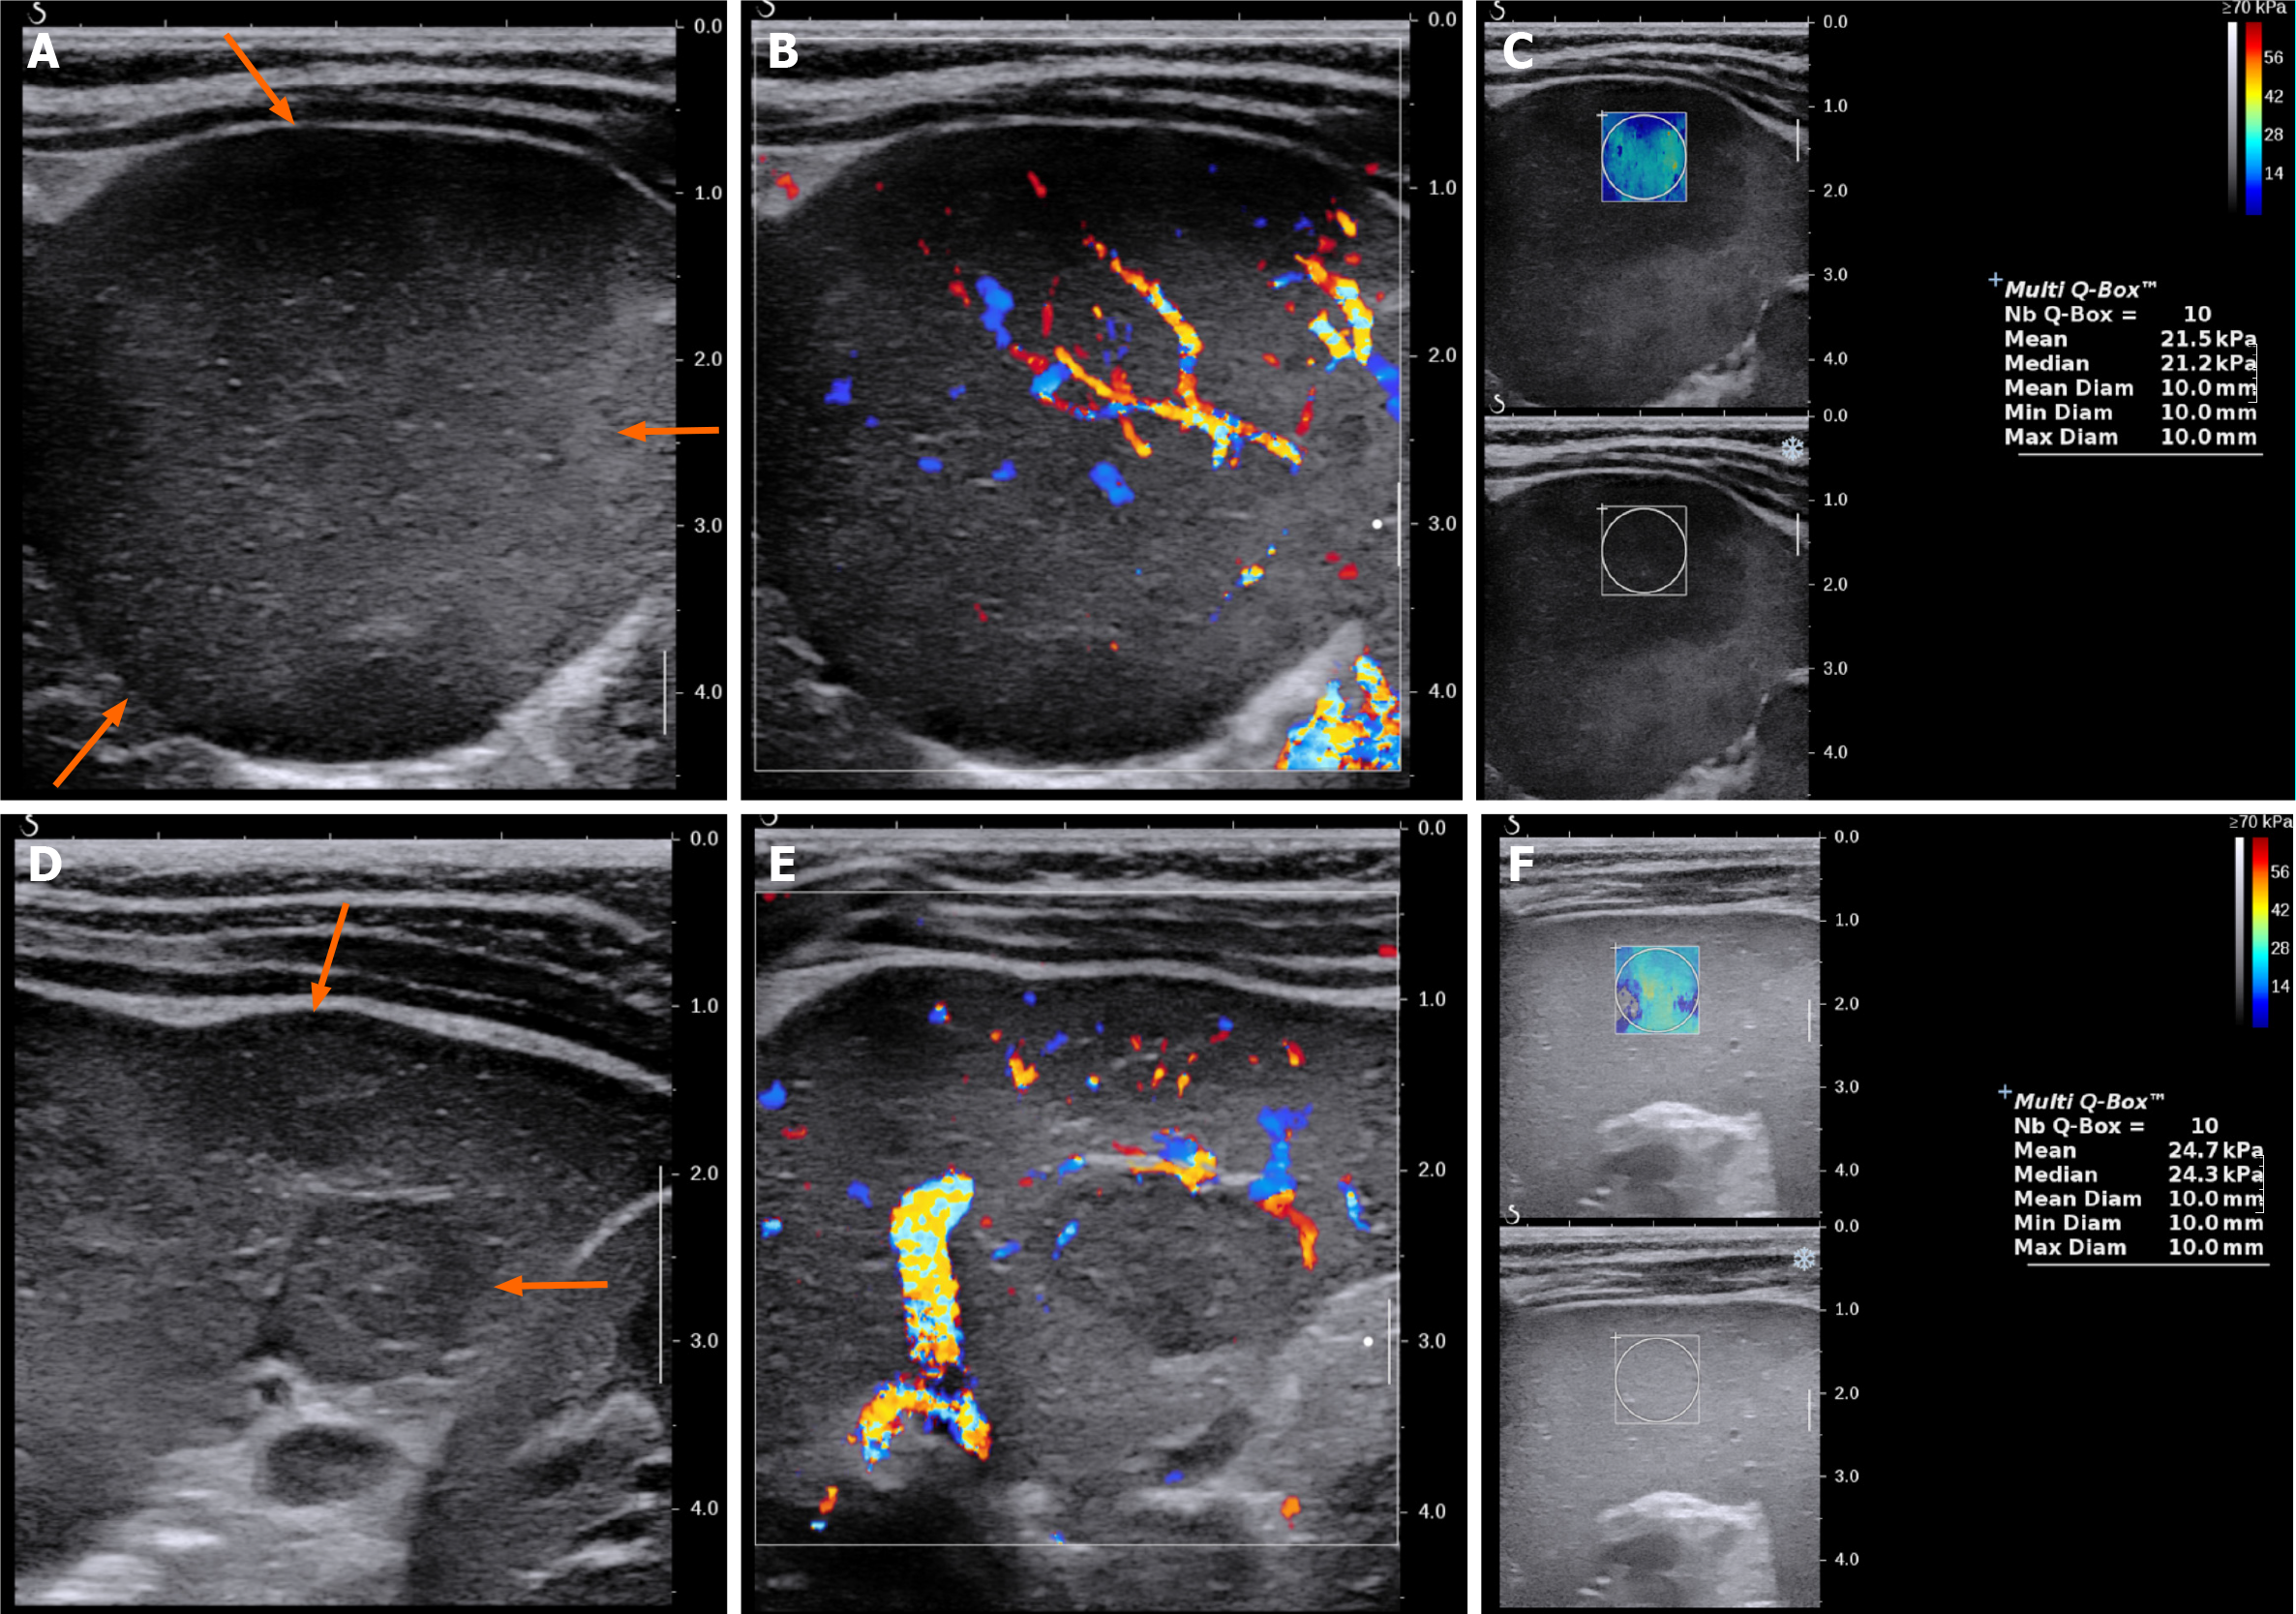
Figure 1 Ultrasound images of two solid spleen masses.
A and D: B-mode images demonstrated irregular and hypoechoic masses; B and E: Color Doppler images showed similar mass vascularity to that of a normal area of the spleen; C and F: Shear wave elastography showed similar shear wave velocity to that of ad normal area of the spleen.
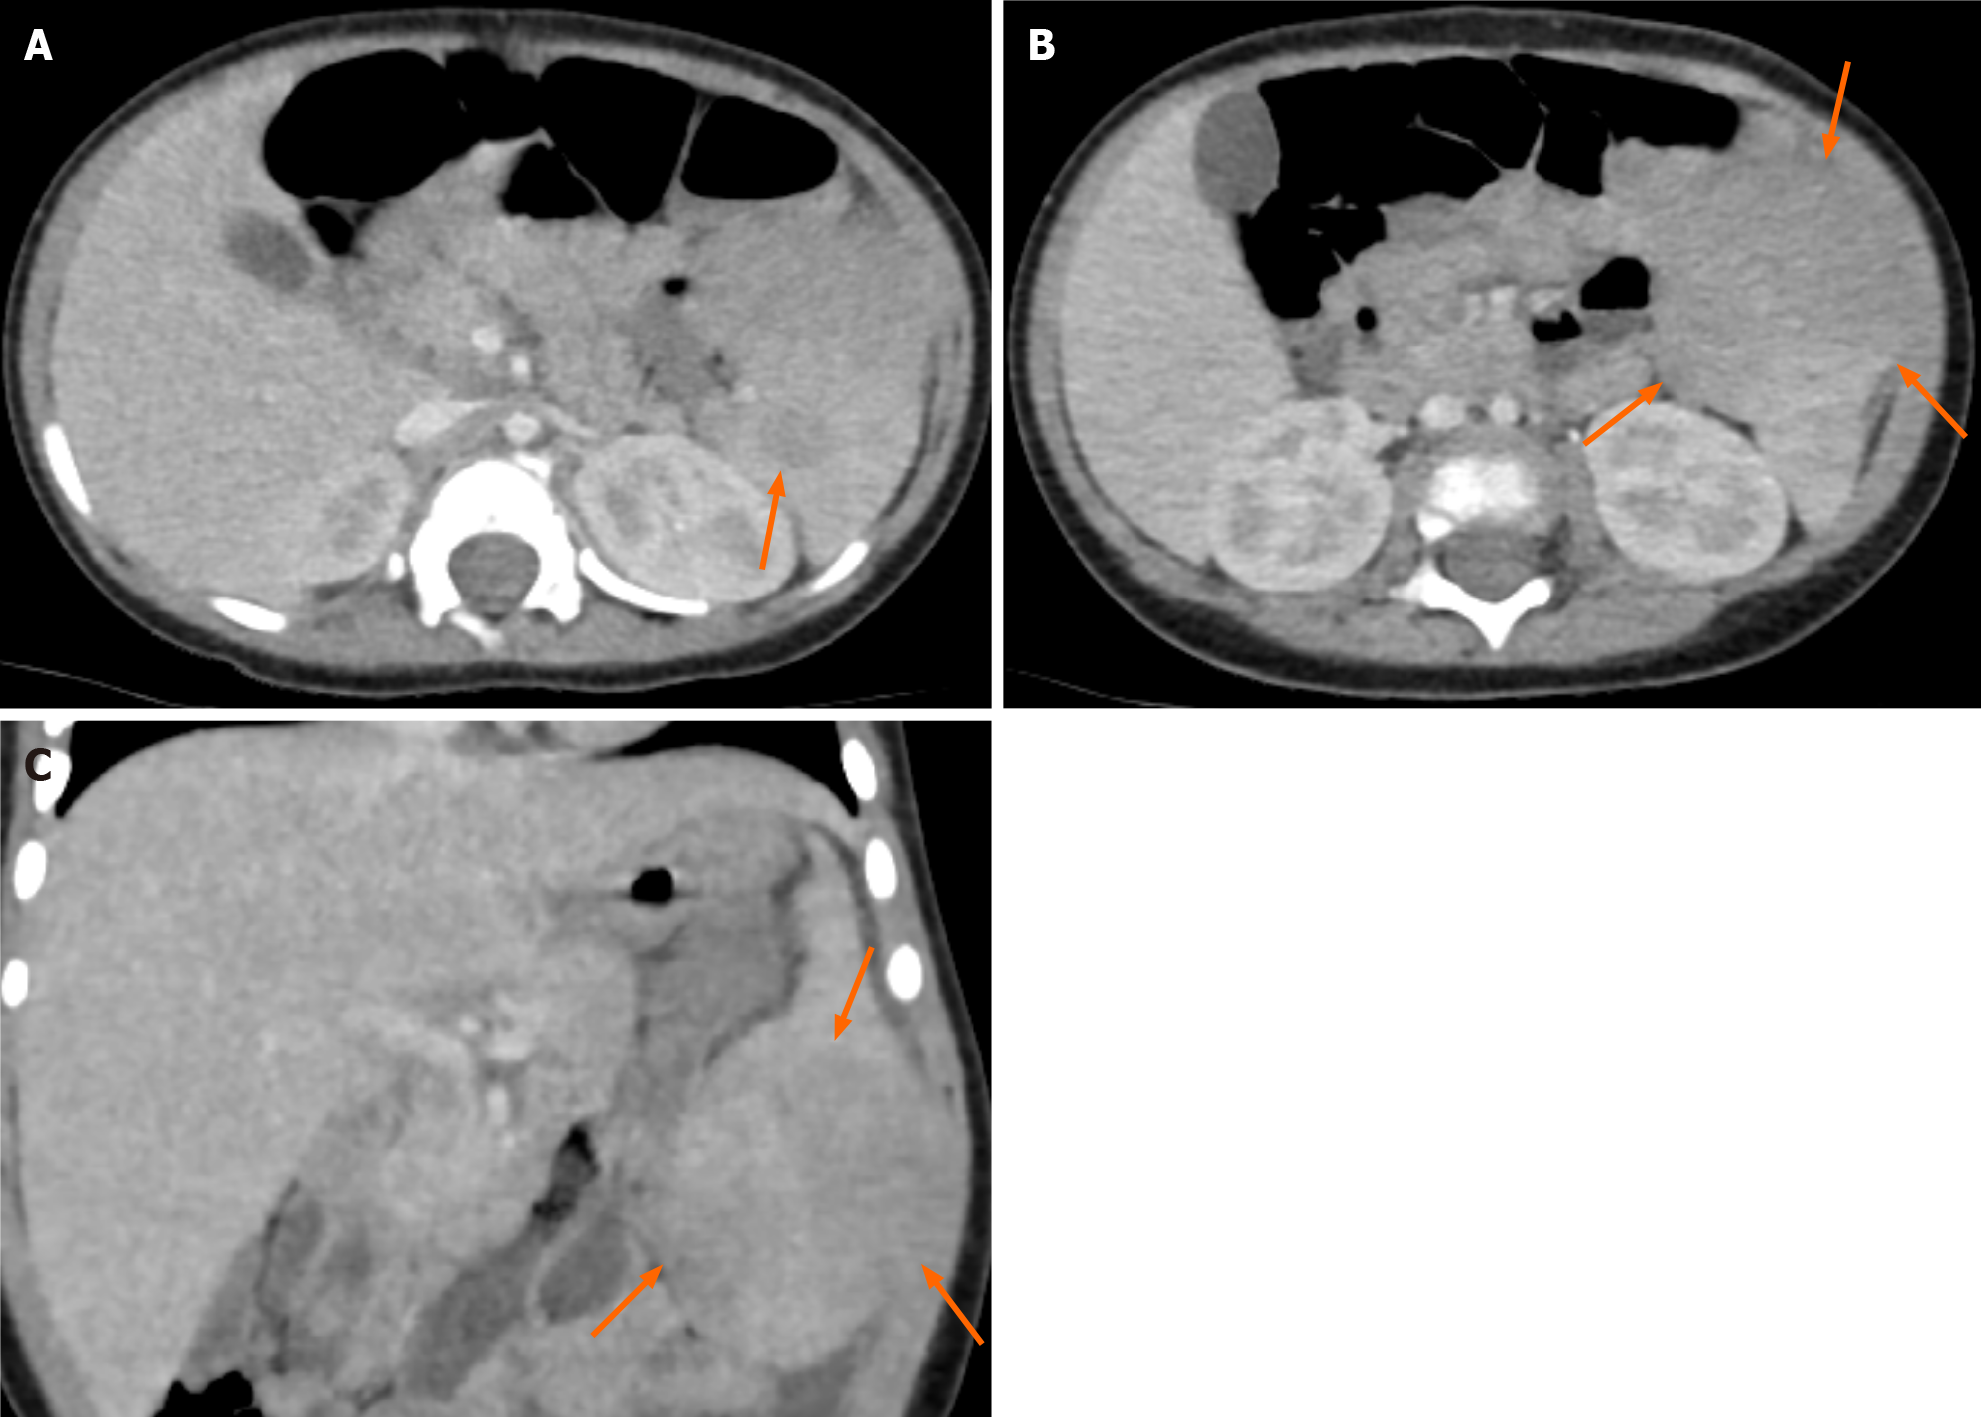
Figure 2 Computed tomography images of two solid splenic masses.
A: Axial image showed smaller hypodense mass; B: Axial image demonstrated larger exophytic hypodense mass; C: Coronal image revealed larger exophytic hypodense mass.
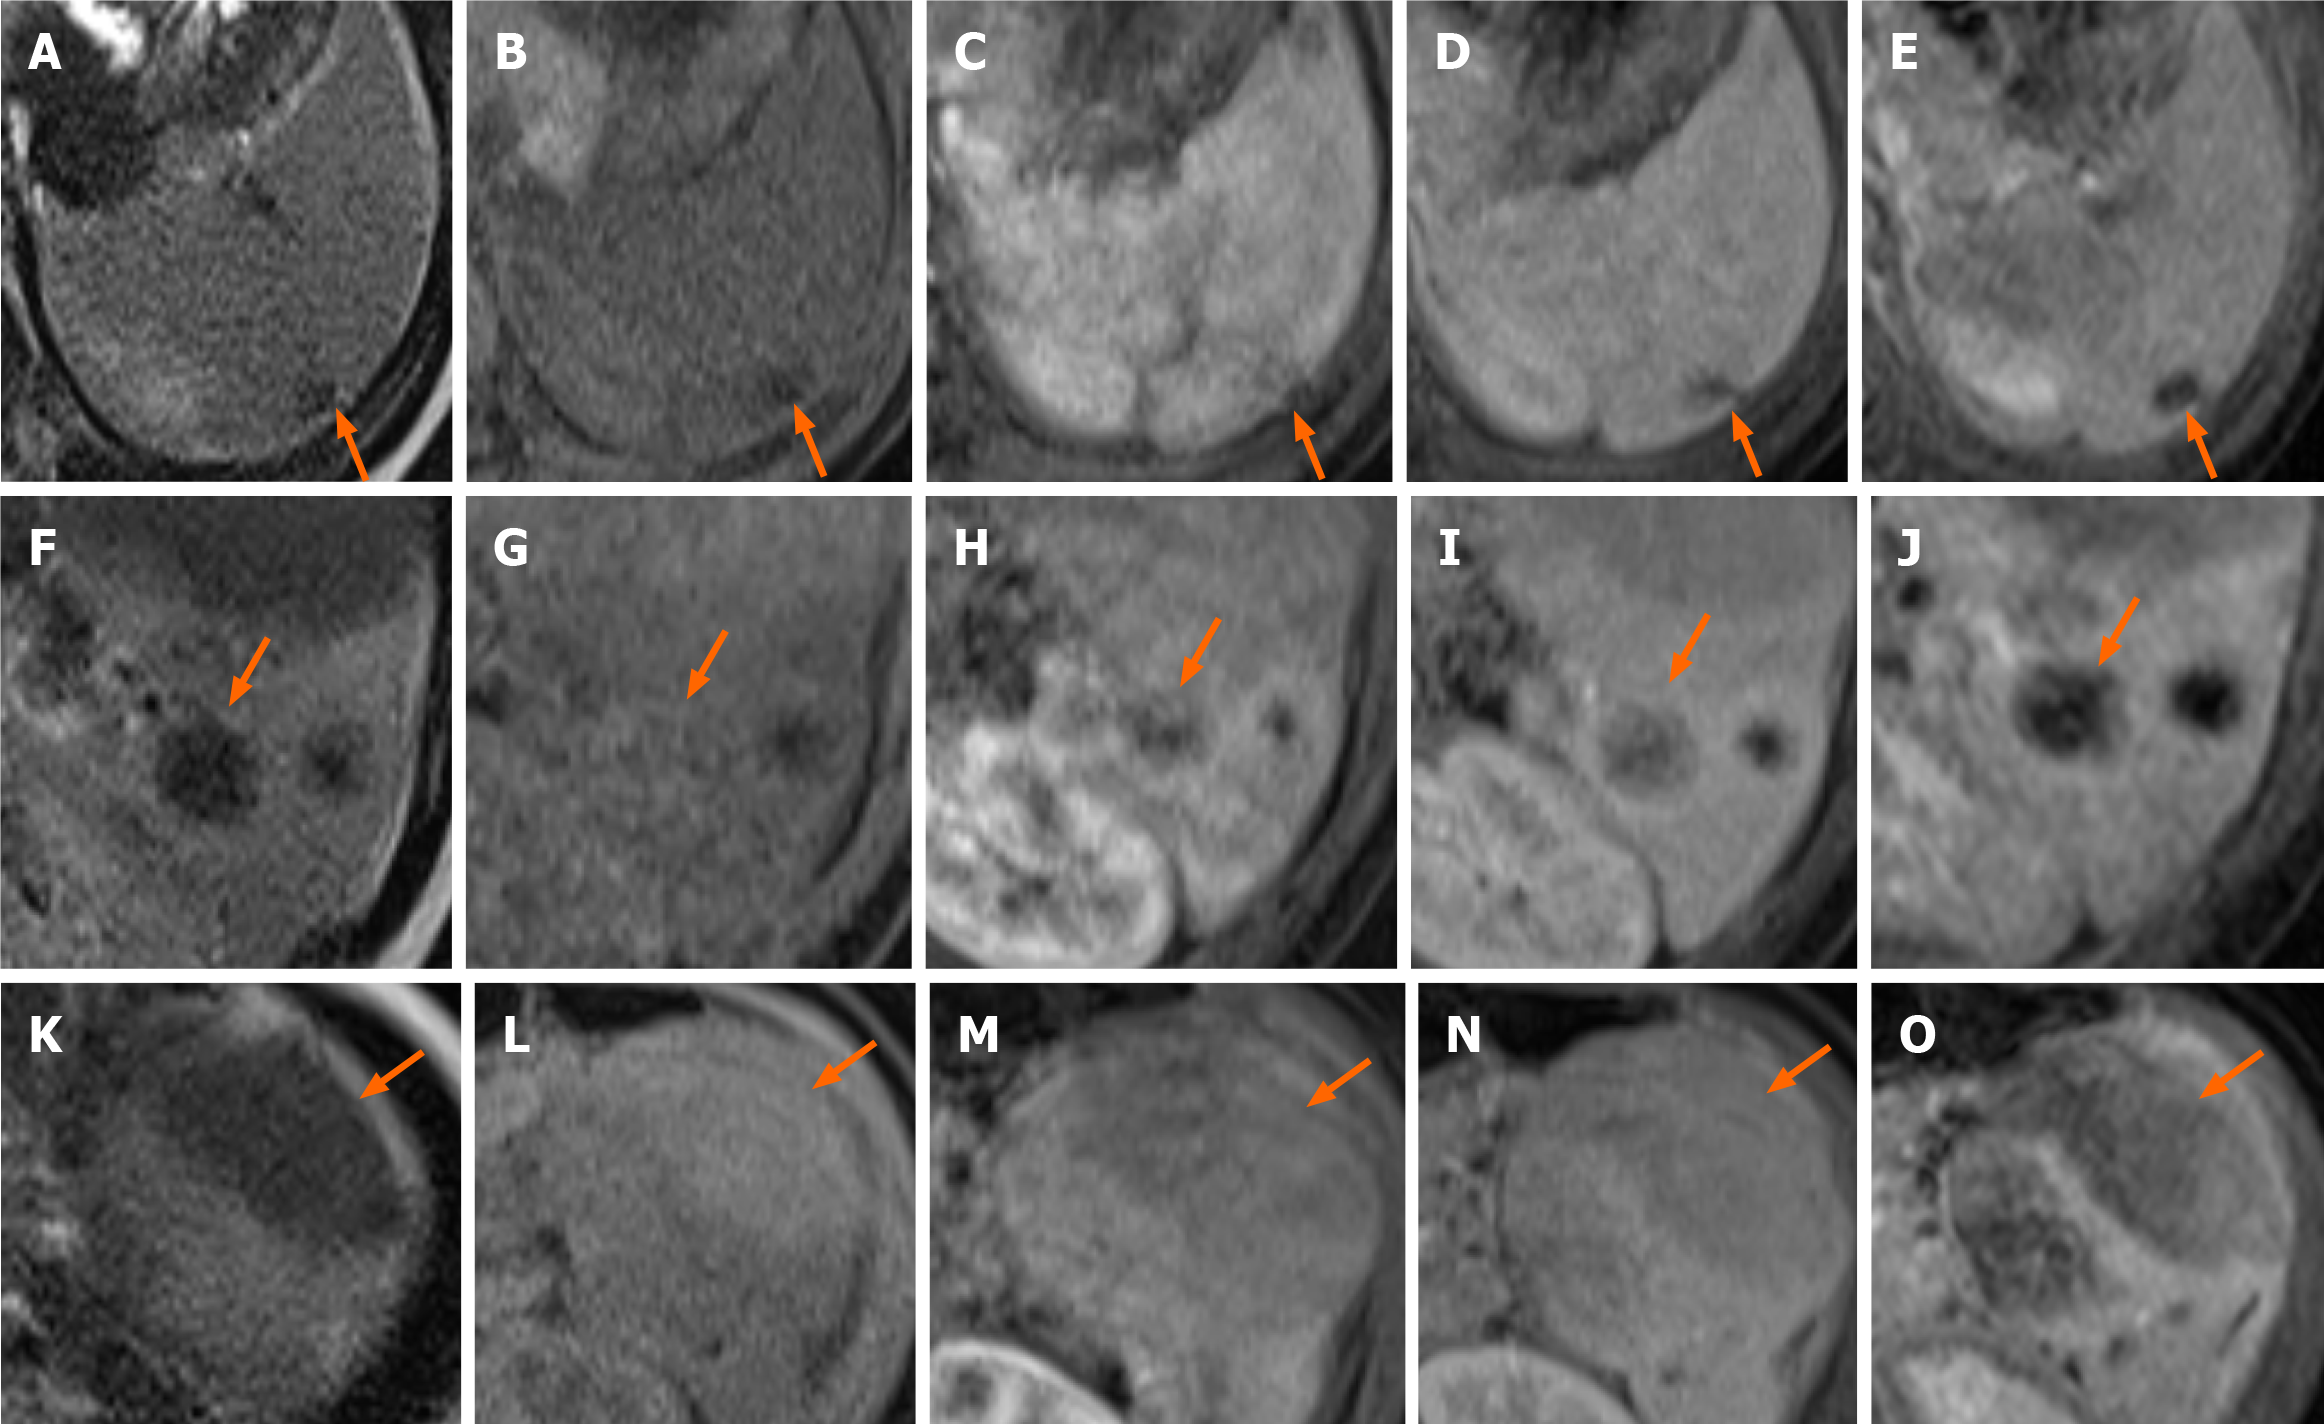
Figure 3 Magnetic resonance images of splenic masses.
A-E: Magnetic resonance imaging (MRI) images demonstrated mass in upper level of spleen; F-J: MRI images showed mass in middle level of spleen; K-O: MRI images illustrated mass in lower level of spleen. A, F and K: Splenic masses showed low signal intensity on T2-weighted images; B, G and L: Splenic masses demonstrated various signal intensities on T1-weighted images; C, H and M: Splenic masses showed low signal intensity in the late arterial phase; D, I and N: Splenic masses showed persistent low signal intensity in the portal venous phase; E, J and O: Splenic masses showed still low signal intensity in the 5-min delayed phase.
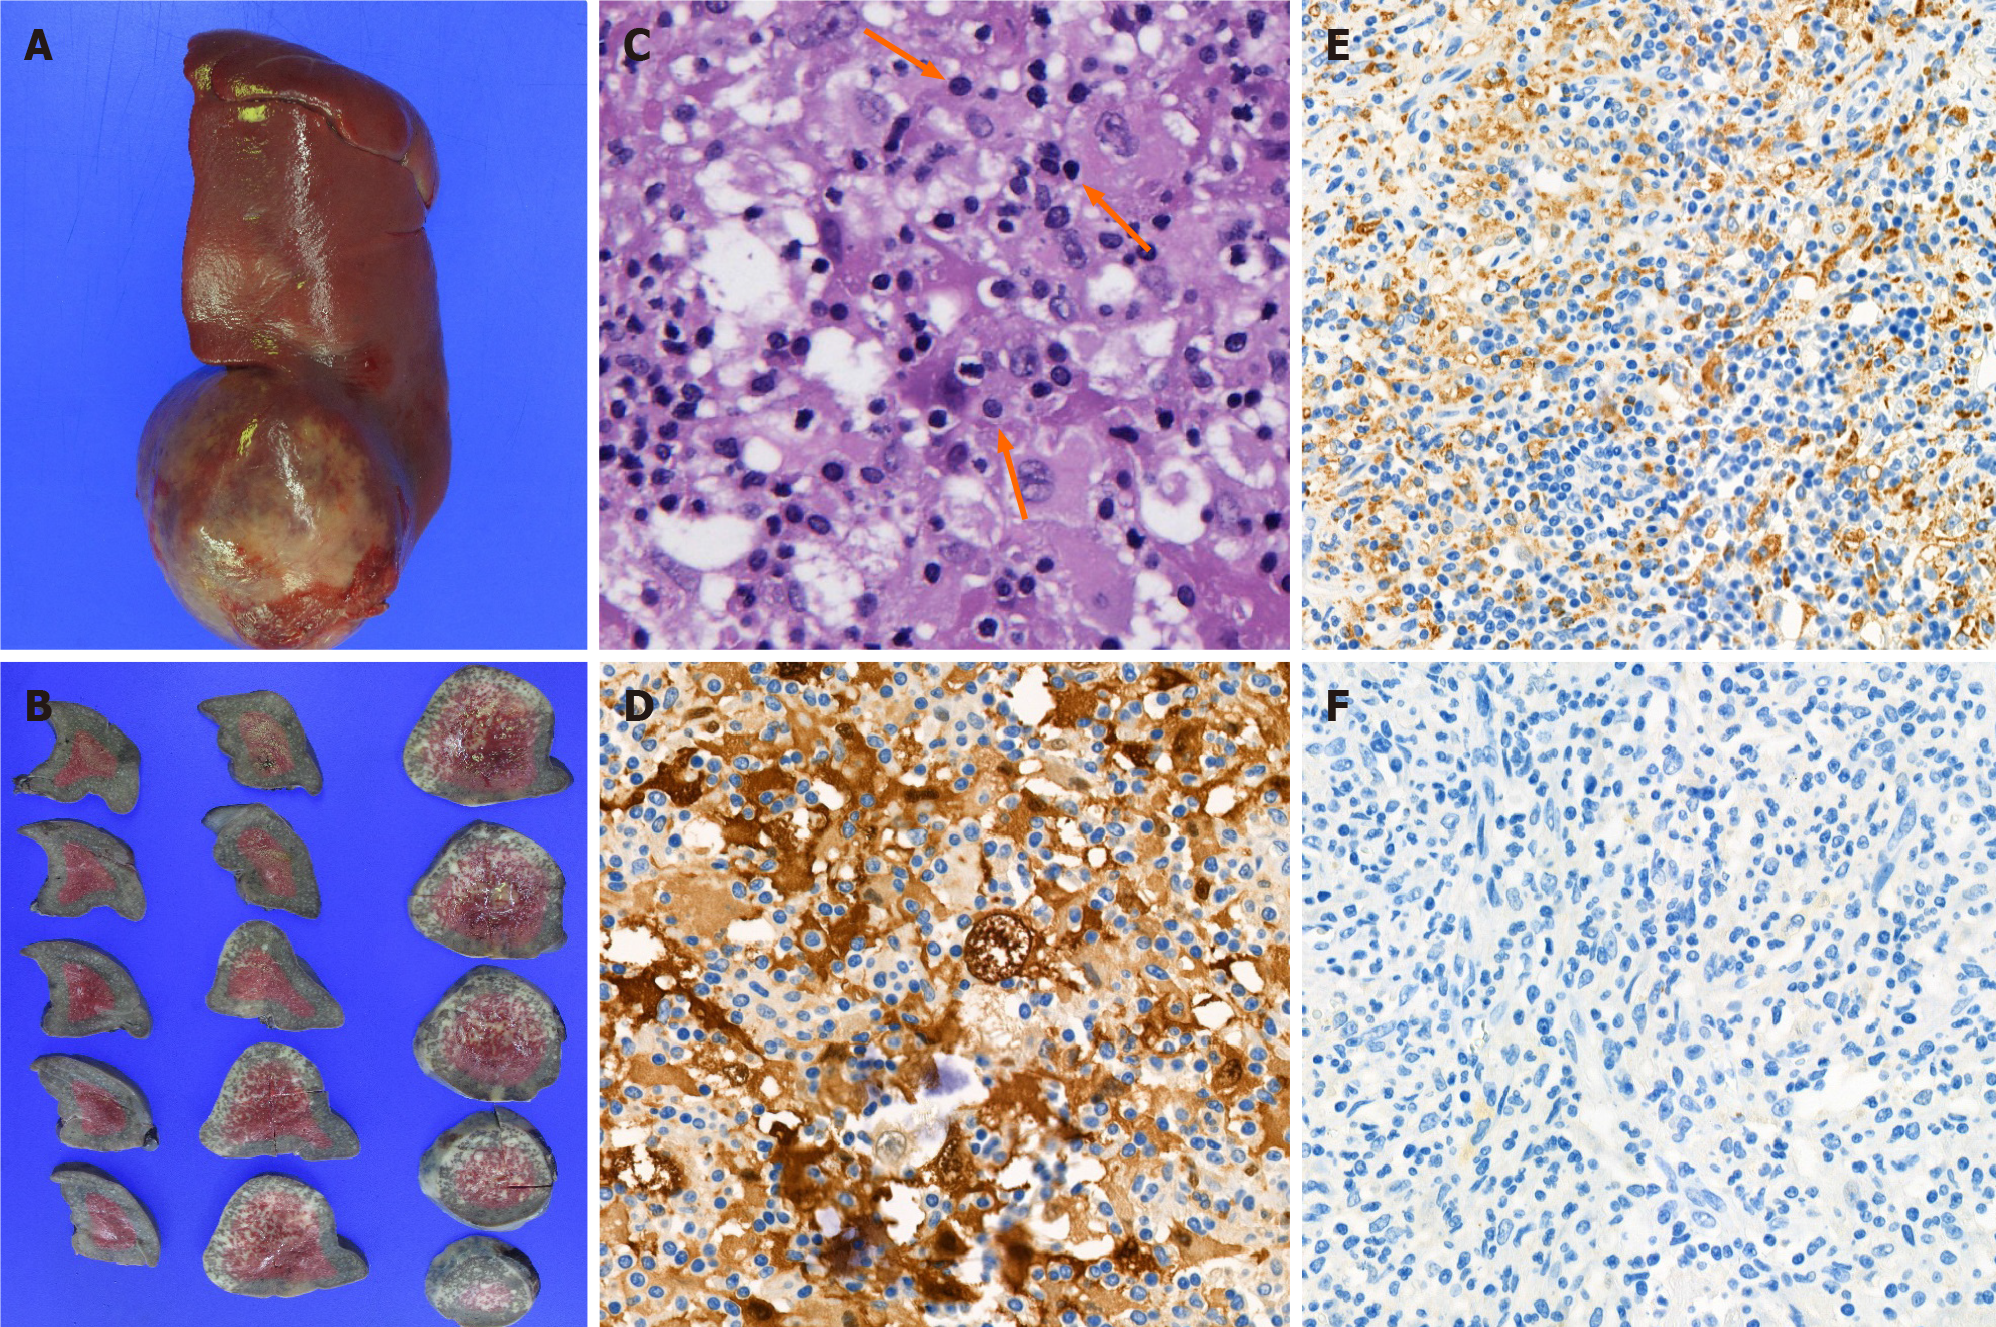
Figure 4 Pathologic images of splenic masses.
A: Resected specimen showed contour bulging splenic mass; B: Cut surface of the resected specimen; C: Hematoxylin and eosin-stained section (200 ×) showed histiocytic proliferation with emperipolesis (arrows); D: Proliferating histiocytes were positive for S-100 protein stained section (400 ×); E: Proliferating histiocytes were positive for CD68 antigen stained section (400 ×); F: proliferating histiocytes were negative for CD1a stained section (400 ×).
- Citation: Ryu H, Hwang JY, Kim YW, Kim TU, Jang JY, Park SE, Yang EJ, Shin DH. Rosai-Dorfman disease in the spleen of a pediatric patient: A case report. World J Clin Cases 2021; 9(21): 6032-6040
- URL: https://www.wjgnet.com/2307-8960/full/v9/i21/6032.htm
- DOI: https://dx.doi.org/10.12998/wjcc.v9.i21.6032


