Copyright
©The Author(s) 2015.
World J Cardiol. Dec 26, 2015; 7(12): 861-874
Published online Dec 26, 2015. doi: 10.4330/wjc.v7.i12.861
Published online Dec 26, 2015. doi: 10.4330/wjc.v7.i12.861
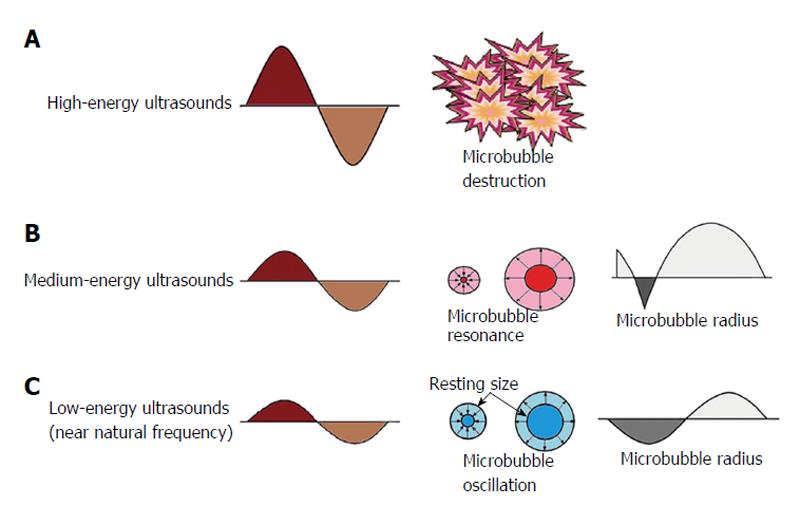
Figure 1 Behavior of microbubbles in an ultrasonic field.
An acoustic wave generated by an ultrasound system consists of alternating high and low pressures: The positive pressure compresses the microbubble, and the negative pressure expands it. High-energy ultrasound (within the energy levels used for diagnostic echocardiographic imaging) destroys microbubbles (A); Intermediate energy ultrasound triggers asymmetrical nonlinear oscillations of microbubbles so that the magnitude of compression and rarefaction waves are not the same with each oscillation, and frequencies other than (e.g., multiple of) the intrinsic fundamental frequency are generated (B); Low-energy ultrasound causes microbubbles to oscillate linearly, which reflects ultrasound at their intrinsic fundamental frequency (C).
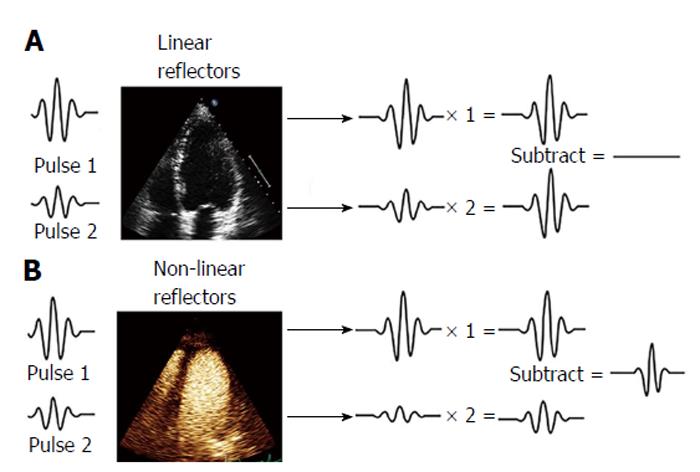
Figure 2 Pulse inversion harmonic imaging signal processing: Effects on linear and non-linear reflectors.
This technique consists of the transmission of a first pulse and a second inverted replica of the first pulse. Any linear target, such as blood in conventional echocardiography, responds equally to positive and negative pressures (A) and reflects back to the transducer equal but opposite echoes, which will be canceled (blood displayed in black in 2-dimensional echocardiography); B: Pulse 1 and pulse 2 excite microbubbles generating fundamental and higher order harmonic responses with different phases that constructively add.
Figure 3 Power modulation imaging.
This technique changes the amplitude of each successive pulse in a group of transmitted pulses and detects the differential nonlinear responses generated from two different excitations. Microbubbles’ response to multipulse cancellation technique produces ultra-harmonic oscillations that are detected in the field of higher frequencies.
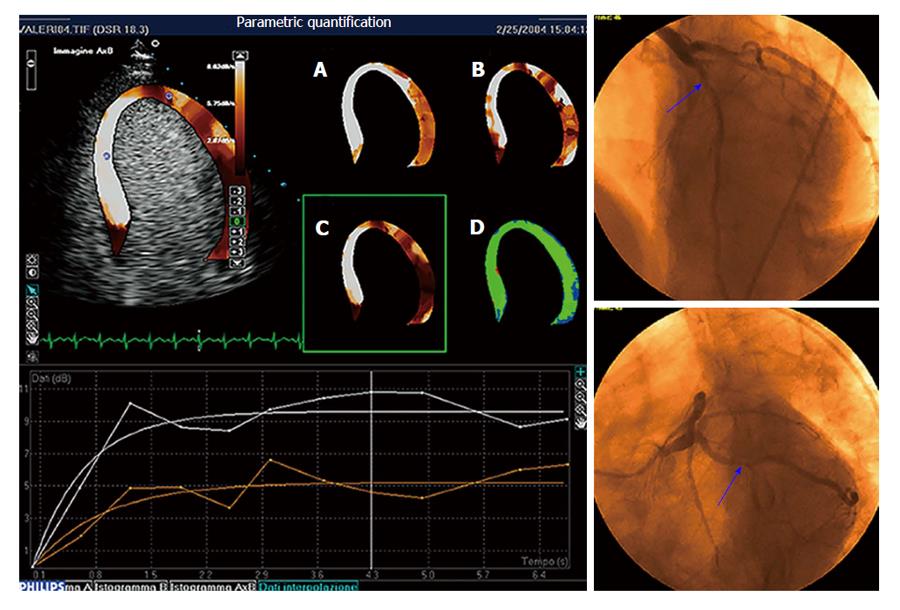
Figure 4 Parametric quantification of myocardial perfusion.
Critical stenosis of the circumflex artery is present at coronary angiography (right panels). Parametric images of peak dipyridamole stress echo reported in panels A through D represent, respectively, the plateau value A of the contrast replenishment curve, the slope β of the replenishment curve, the A ×β value, and the goodness of fitting. The A ×β value parametric imaging is also displayed superimposed onto the apical four-chamber view in the top left panel. Replenishment time-course curves (sampling and interpolation) relative to the septum (white curves) and the apico-lateral wall (red curves) are reported in the graph at the bottom. Flow is reduced in the territory perfused by circumflex artery.
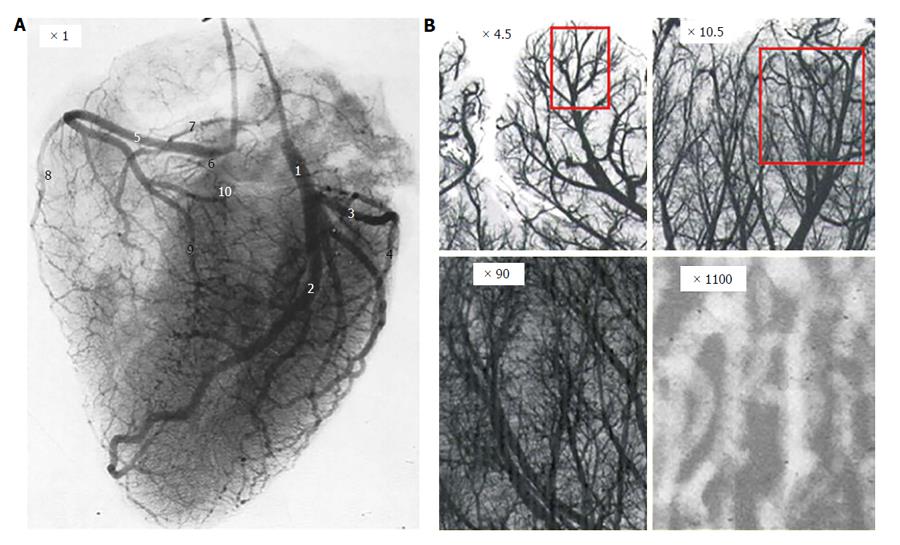
Figure 5 Coronary artery tree arborization.
A: Angiographic still frame of left and right coronary arteries of an isolated human heart after injection of radiopaque dye; B: Progressive magnification of a region of interest showing the coronary tree fractal anatomy.
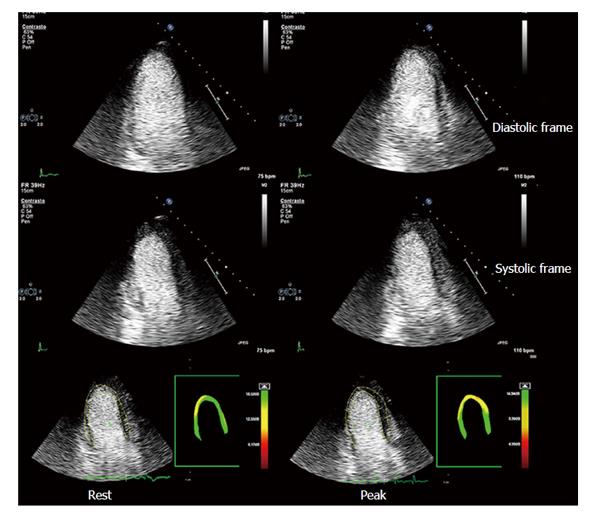
Figure 6 Myocardial contrast stress echocardiography.
Apical three-chamber view of a patient with previous by-pass graft (left internal mammary artery graft onto left anterior descending coronary artery). Baseline diastolic and systolic frames on the left, top and intermediate rows, respectively; peak stress diastolic and systolic frames on the right, top and intermediate rows, respectively. Baseline and peak stress myocardial perfusion parametric quantification are displayed, respectively, in the bottom left and right panels. At baseline, akinesis of the infero-apical region is evident, which is concordant with a transmural defect of perfusion of the same region. At peak stress, no new wall motion abnormalities are detected, whereas parametric quantification of myocardial perfusion shows a large transmural defect of perfusion of all the apical regions and a subendocardial defect of perfusion of middle and basal anterior septum. A critical stenosis of distal mammary graft anastomosis was found on coronary angiography.
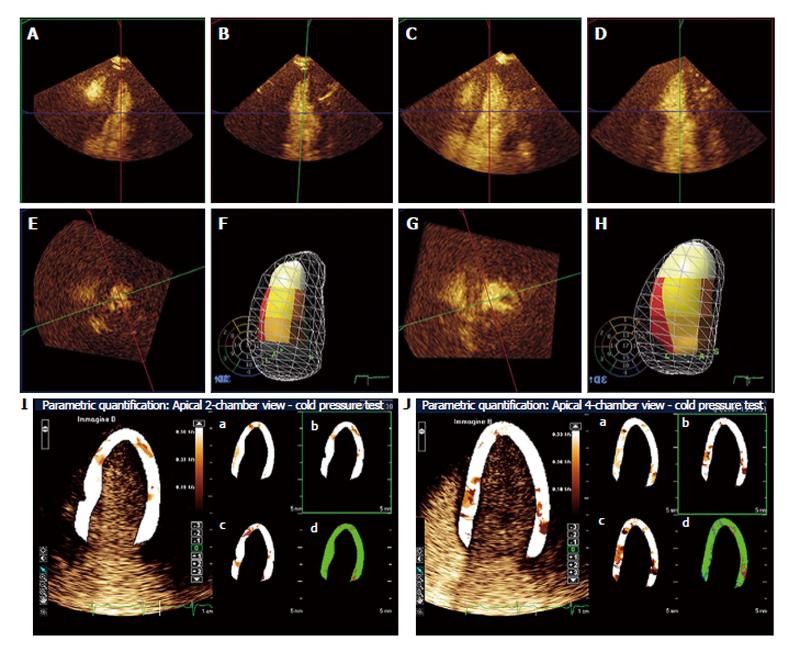
Figure 7 Real-time 3-dimensional myocardial contrast echocardiography during follow-up using cold pressor test in a patient who recovered from apical ballooning syndrome.
A, B and E: Reconstructed 4-chamber (A), 2-chamber (B) and short-axis (E) end-systolic frames at baseline; F: 3-dimensional systolic volume rendering as left ventricular cast inside the diastolic mesh volume rendering. The American Society of Echocardiography 17-segment model of the left ventricle is reproduced as a bulls-eye in the background, and superimposed color-coded onto the left ventricular cast; C, D and G: Reconstructed 4-chamber (C), 2-chamber (D) and short-axis (G) end-systolic frames using the cold pressor test; H: The diastolic and systolic 3-dimensional casts as in panel 1d. Note that wall motion is normal at baseline, whereas apical akinesia develops during the cold pressor test; I and J: Apical 2-chamber and 4-chamber, respectively, parametric myocardial contrast echocardiography quantification using the cold pressor test; the slope β of the replenishment curve is superimposed onto the left ventricular wall in 2-chamber and 4-chamber views, respectively. Perfusion parameters A, β and A ×β are superimposed onto the same left ventricular wall as in panels I and J, respectively, in panels a, b and c; panels d represents the goodness of fit. Parametric images demonstrate homogeneous perfusion during the cold pressor test. The coronary flow reserve in this patient was 1.10 (normal range 2.77 ± 0.70).
- Citation: Barletta G, Del Bene MR. Myocardial perfusion echocardiography and coronary microvascular dysfunction. World J Cardiol 2015; 7(12): 861-874
- URL: https://www.wjgnet.com/1949-8462/full/v7/i12/861.htm
- DOI: https://dx.doi.org/10.4330/wjc.v7.i12.861


