Copyright
©The Author(s) 2015.
World J Cardiol. Dec 26, 2015; 7(12): 861-874
Published online Dec 26, 2015. doi: 10.4330/wjc.v7.i12.861
Published online Dec 26, 2015. doi: 10.4330/wjc.v7.i12.861
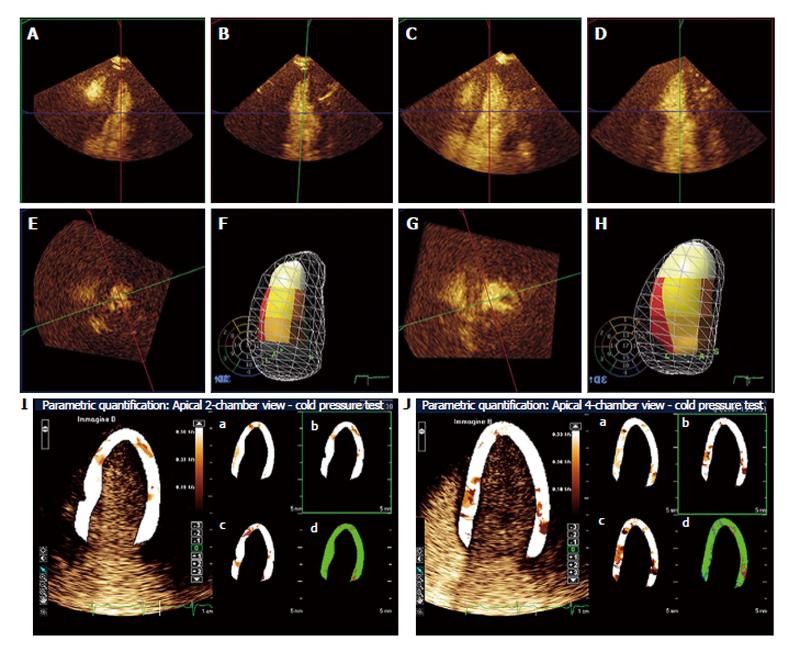
Figure 7 Real-time 3-dimensional myocardial contrast echocardiography during follow-up using cold pressor test in a patient who recovered from apical ballooning syndrome.
A, B and E: Reconstructed 4-chamber (A), 2-chamber (B) and short-axis (E) end-systolic frames at baseline; F: 3-dimensional systolic volume rendering as left ventricular cast inside the diastolic mesh volume rendering. The American Society of Echocardiography 17-segment model of the left ventricle is reproduced as a bulls-eye in the background, and superimposed color-coded onto the left ventricular cast; C, D and G: Reconstructed 4-chamber (C), 2-chamber (D) and short-axis (G) end-systolic frames using the cold pressor test; H: The diastolic and systolic 3-dimensional casts as in panel 1d. Note that wall motion is normal at baseline, whereas apical akinesia develops during the cold pressor test; I and J: Apical 2-chamber and 4-chamber, respectively, parametric myocardial contrast echocardiography quantification using the cold pressor test; the slope β of the replenishment curve is superimposed onto the left ventricular wall in 2-chamber and 4-chamber views, respectively. Perfusion parameters A, β and A ×β are superimposed onto the same left ventricular wall as in panels I and J, respectively, in panels a, b and c; panels d represents the goodness of fit. Parametric images demonstrate homogeneous perfusion during the cold pressor test. The coronary flow reserve in this patient was 1.10 (normal range 2.77 ± 0.70).
- Citation: Barletta G, Del Bene MR. Myocardial perfusion echocardiography and coronary microvascular dysfunction. World J Cardiol 2015; 7(12): 861-874
- URL: https://www.wjgnet.com/1949-8462/full/v7/i12/861.htm
- DOI: https://dx.doi.org/10.4330/wjc.v7.i12.861


