Copyright
©2012 Baishideng.
World J Stem Cells. Jul 26, 2012; 4(7): 71-79
Published online Jul 26, 2012. doi: 10.4252/wjsc.v4.i7.71
Published online Jul 26, 2012. doi: 10.4252/wjsc.v4.i7.71
Figure 1 A schematic diagram of the pEF6-mCherry plasmid.
MCS-multiple cloning site of the pEF6-V5/His vector.
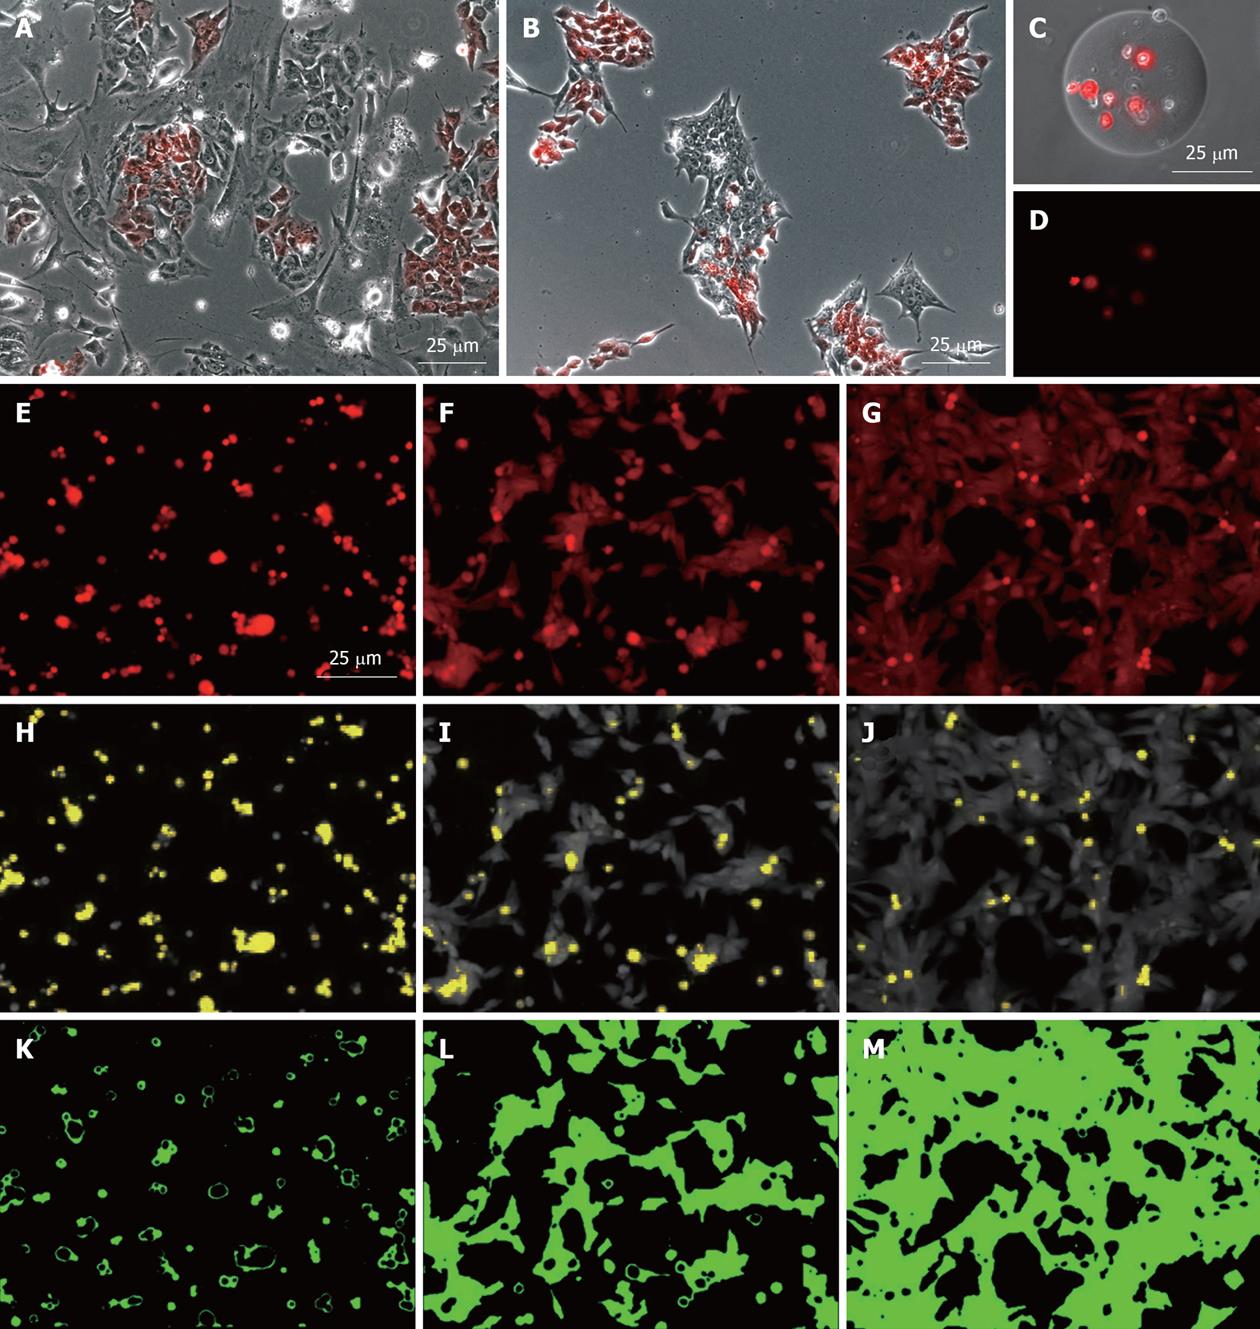
Figure 2 Utility of the MEL2-mCherry line in various analyses of human embryonic stem cell behavior.
Robust mCherry expression of the MEL2-mCherry line allows for analysis of cellular behavior such as (A) mobility on various substrates or (B) mode of colony formation after mixing with non-fluorescent parental MEL2 human embryonic stem (hES) cells or (C, D) following encapsulation into transparent microcarriers; E-M: Utility of the MEL2-mCherry line for the analysis of cellular adhesion to various substrates. Uniformity and robustness of mCherry expression, in combination with its uniform distribution throughout the cell, allows the use of fluorescence level distribution to quantify cell adhesion (E-G), to identify dead, unattached cells (yellow in H-J), and accurately determine the area of substrate coverage by live hES cells (K-M). From left to right, three different ECM molecules were tested. In this substrate set relative areas of surface coverage were 4.4%, 41.7% and 76.2%.
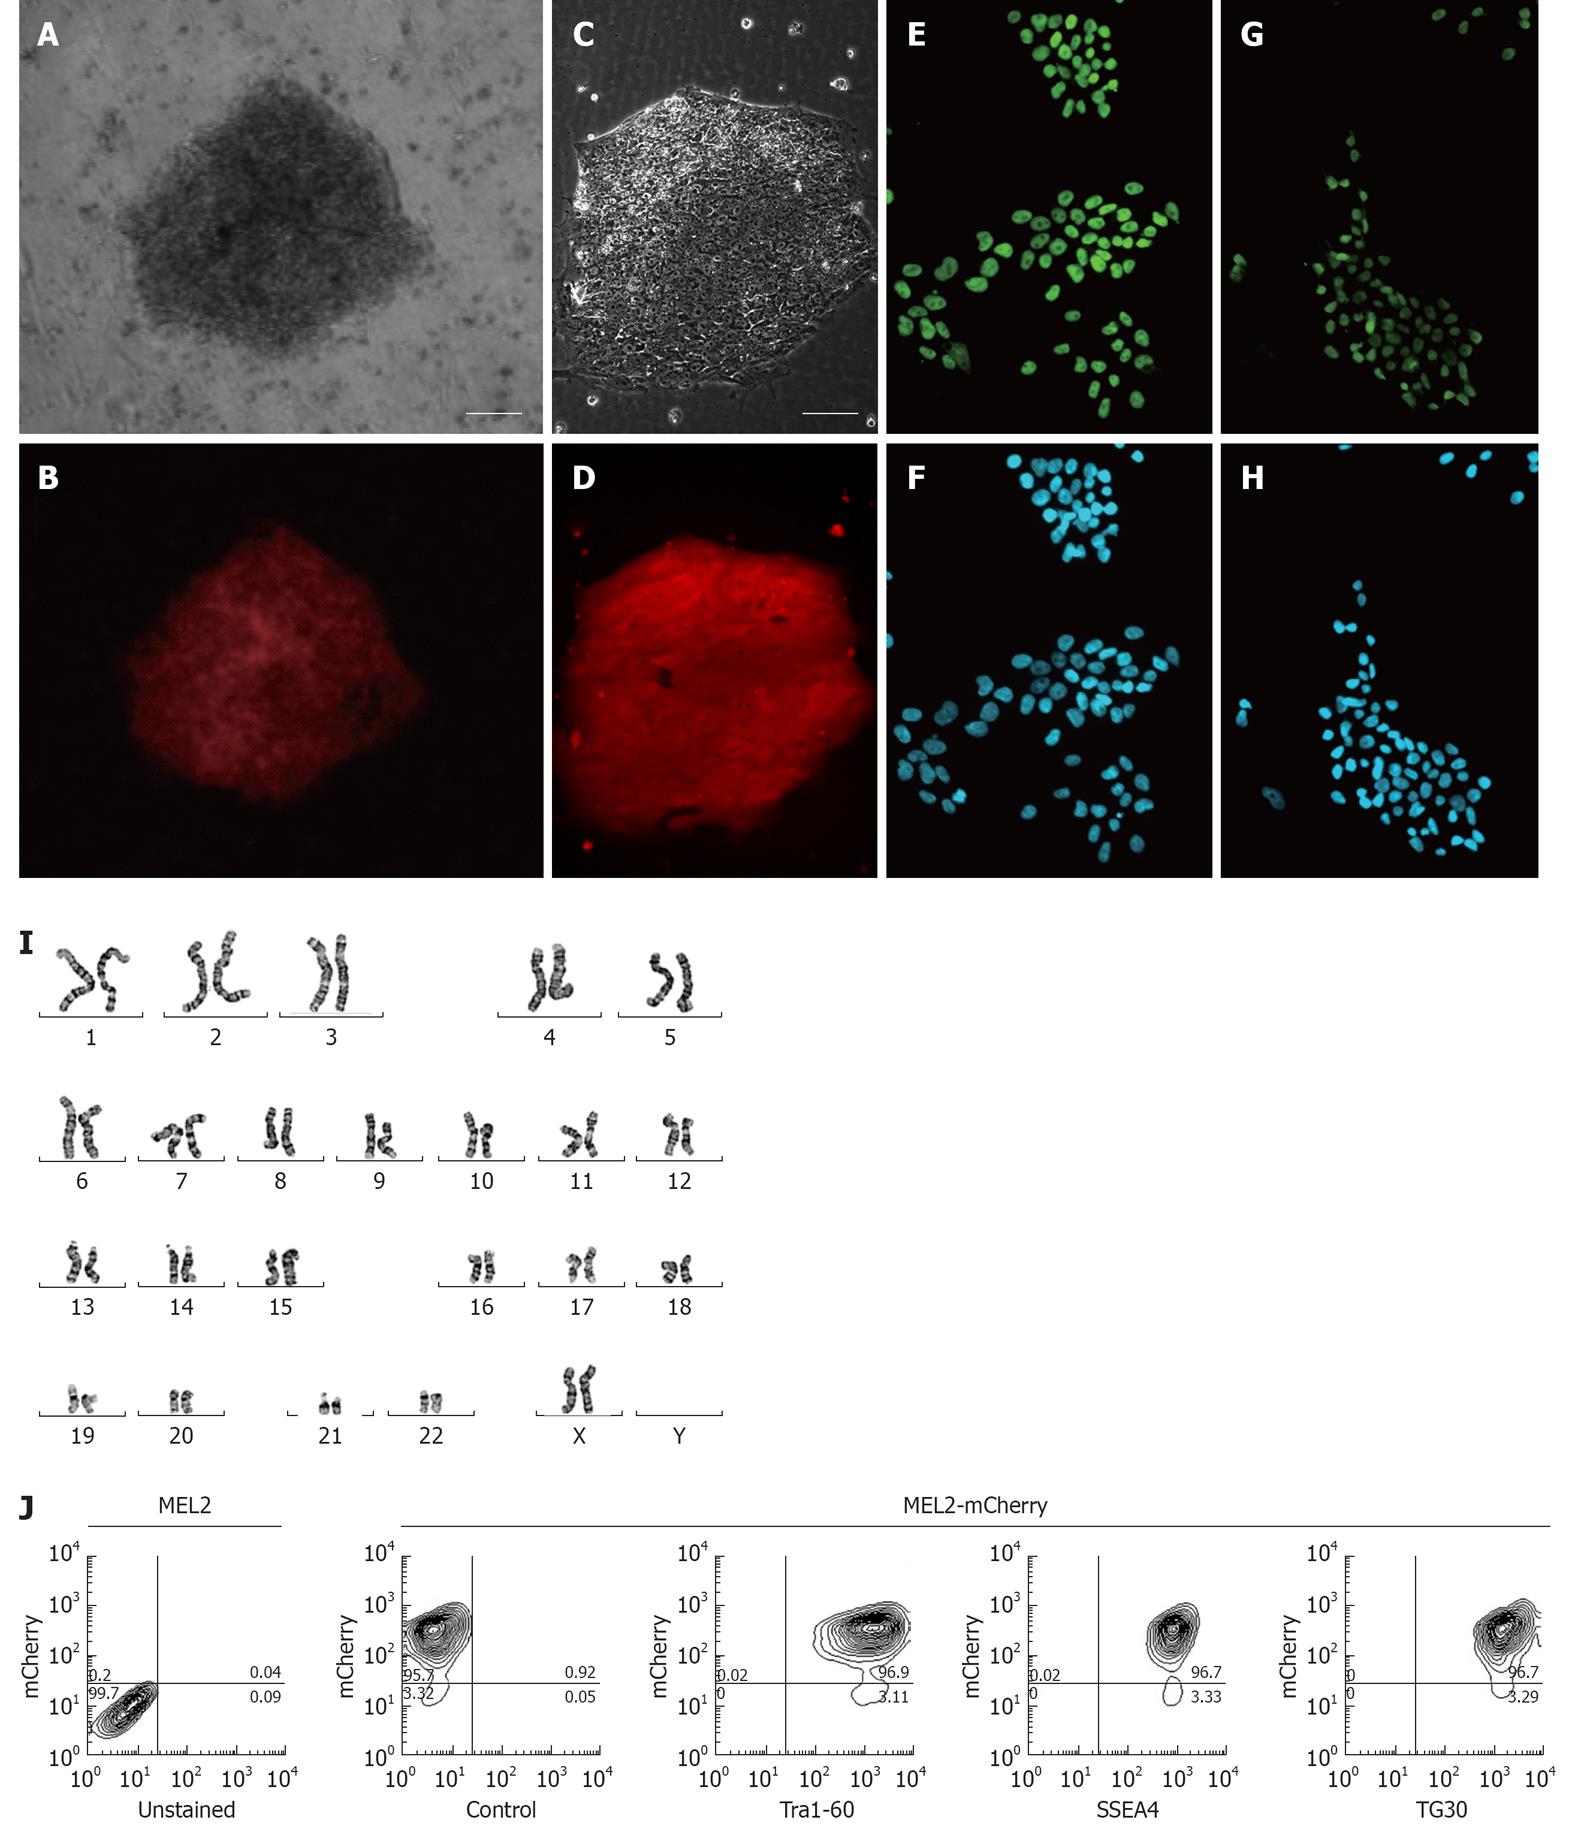
Figure 3 Characterization of the MEL2-mCherry human embryonic stem cell line.
(A) Brightfield and (B) red mCherry fluorescence of a colony of MEL2 human embryonic stem cell (hESC) transfected with Ef1a-mCherry plasmid 12 d after Blasticidin selection (scale bar = 100 μm). (C) Brightfield and (D) red mCherry fluorescence of a colony of single-cell passaging-adapted MEL2-mCherry hESC grown on Matrigel (scale bar = 100 μm). (E) POU5F1/OCT4 expression and (F) corresponding DAPI nuclear staining of MEL2-mCherry hESC. (G) NANOG protein expression and (H) corresponding DAPI nuclear staining in nuclei of MEL2-mCherry cells. (I) Normal human female karyotype of MEL2-mCherry hESC at passage 15 (Giemsa stain of a representative metaphase chromosome spread shown). (J) FACS analysis showing high levels of mCherry fluorescence (95.7%, i.e.,) and the presence of high levels of pluripotency-associated surface antigens Tra1-60, SSEA4 and TG30(CD9). Control-a representative primary isotype control antibody staining.
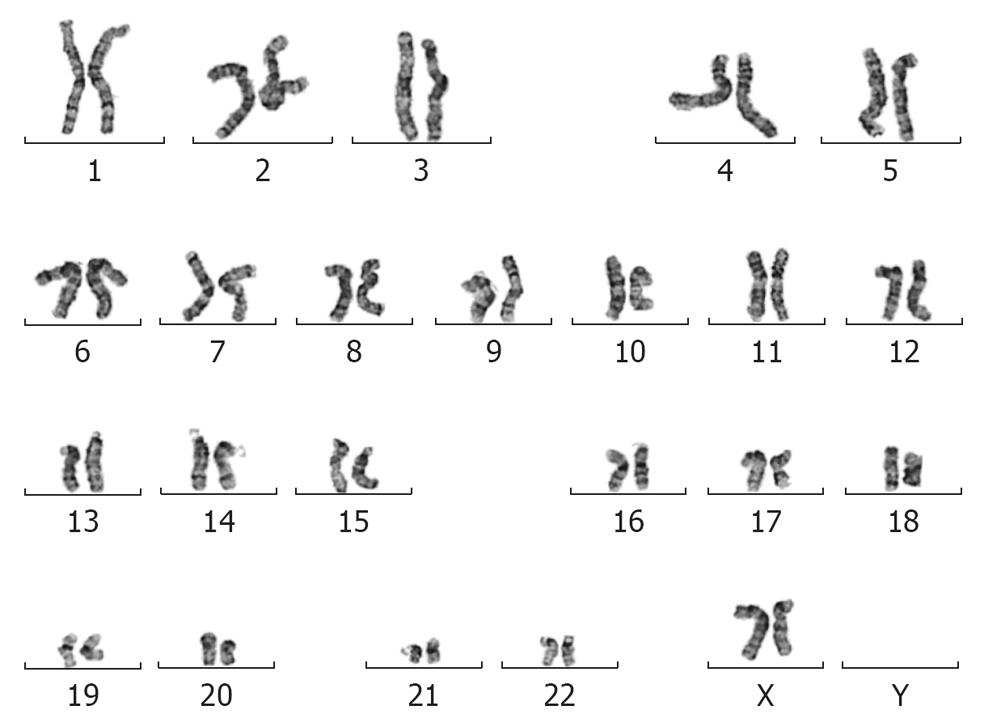
Figure 4 Giemsa-stained representative chromosomal spread of the MEL2-mCherry cell line after 35 passages.
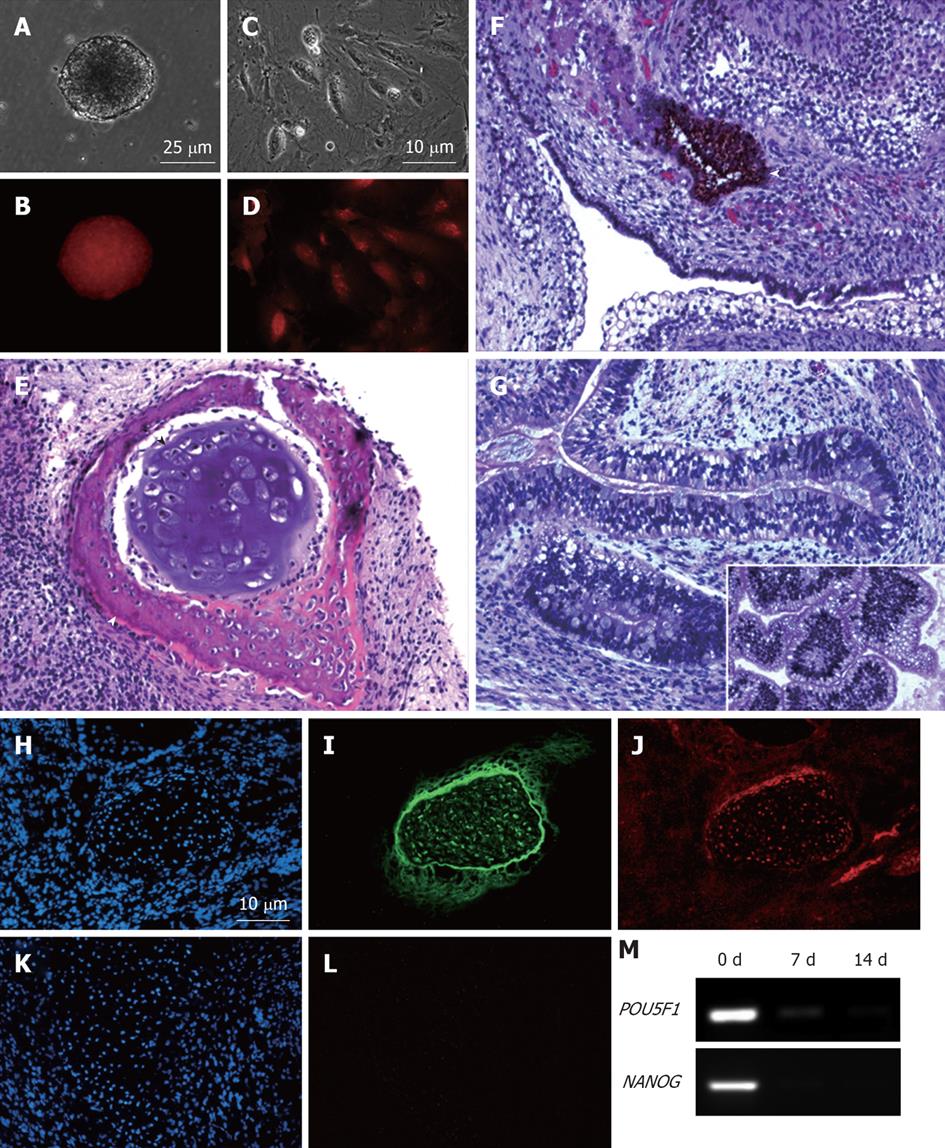
Figure 5 MEL2-mCherry line is capable of full-spectrum differentiation and retains high levels of mCherry fluorescence.
(A) Brightfield and (B) Red fluorescence images of a typical EB derived from the MEL2-mCherry line showing robust uniform fluorescence. (C) Brightfield image and (D) Red mCherry fluorescence of cells dissociated from MEL2-mCherry human embryonic stem cell (hESC) derived embryoid bodies. (E-G) Teratoma sections showing the presence of derivatives of all three major germ layer: (E) Mesoderm-derived cartilage (black arrowhead) and bone (white arrowhead); (F) Ectodermally-derived neural epithelium, including melanised retinal epithelium-like structures and (G) Endodermally-derived gut-like epithelium and (inset shows transverse section through the intestinal crypt-like structures). (J) Immunofluorescent detection of the mCherry protein in teratoma cryosections reveals uniform red fluorescence in all cells, including for instance, differentiated chondrocytes expressing high levels of the type II collagen (I). DAPI staining shows blue fluorescence of all nuclei in the sections (H and K). (L) Red fluorescence image of a cryosection incubated with an isotype control. (M) RT-PCR analysis showing down-regulation of pluripotency-associated genes POU5F1/OCT4 and NANOG mRNA expression in EBs following 1 and 2 wk withdrawal of the pluripotency-maintaining factors.
- Citation: Ovchinnikov DA, Turner JP, Titmarsh DM, Thakar NY, Sin DC, Cooper-White JJ, Wolvetang EJ. Generation of a human embryonic stem cell line stably expressing high levels of the fluorescent protein mCherry. World J Stem Cells 2012; 4(7): 71-79
- URL: https://www.wjgnet.com/1948-0210/full/v4/i7/71.htm
- DOI: https://dx.doi.org/10.4252/wjsc.v4.i7.71


