Copyright
©The Author(s) 2003.
World J Gastroenterol. Feb 15, 2003; 9(2): 359-363
Published online Feb 15, 2003. doi: 10.3748/wjg.v9.i2.359
Published online Feb 15, 2003. doi: 10.3748/wjg.v9.i2.359
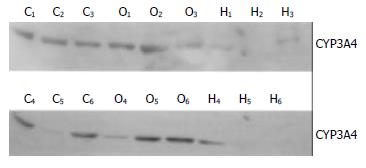
Figure 1 Western Blot analysis of CYP3A4 isoform protein among three groups, compared with controls (tagged by “C1-6”) .
CYP3A4 protein content in liver tissues among patients with cirrhosis (tagged by “H1-6”) reduced. but in obstructive jaundice (tagged by “O1-6”) , There was no change of CYP3A4 protein expression.
- Citation: Yang LQ, Li SJ, Cao YF, Man XB, Yu WF, Wang HY, Wu MC. Different alterations of cytochrome P450 3A4 isoform and its gene expression in livers of patients with chronic liver diseases. World J Gastroenterol 2003; 9(2): 359-363
- URL: https://www.wjgnet.com/1007-9327/full/v9/i2/359.htm
- DOI: https://dx.doi.org/10.3748/wjg.v9.i2.359


