Copyright
©The Author(s) 2003.
World J Gastroenterol. Feb 15, 2003; 9(2): 246-249
Published online Feb 15, 2003. doi: 10.3748/wjg.v9.i2.246
Published online Feb 15, 2003. doi: 10.3748/wjg.v9.i2.246
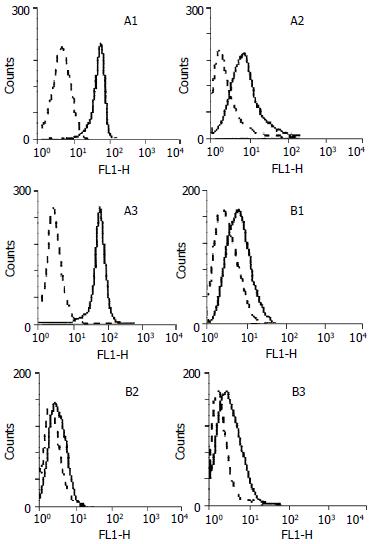
Figure 1 Analysis of COX-2 expressions in gastric cancer tissues and relevant adjacent normal gastric tissues by FACS.
A1, A2, A3: Gastric cancer tissues; B1, B2, B3: Relevant adjacent normal gastric tissues. Dotted lines represent results generated with anti-rabbit-FITC; Solid lines represent results generated with rabbit-anti COX-2 and anti-rabbit-FITC.
-
Citation: Guo XL, Wang LE, Du SY, Fan CL, Li L, Wang P, Yuan Y. Association of cyclooxygenase-2 expression with
Hp-cagA infection in gastric cancer. World J Gastroenterol 2003; 9(2): 246-249 - URL: https://www.wjgnet.com/1007-9327/full/v9/i2/246.htm
- DOI: https://dx.doi.org/10.3748/wjg.v9.i2.246


