Copyright
©The Author(s) 2003.
World J Gastroenterol. Dec 15, 2003; 9(12): 2737-2741
Published online Dec 15, 2003. doi: 10.3748/wjg.v9.i12.2737
Published online Dec 15, 2003. doi: 10.3748/wjg.v9.i12.2737
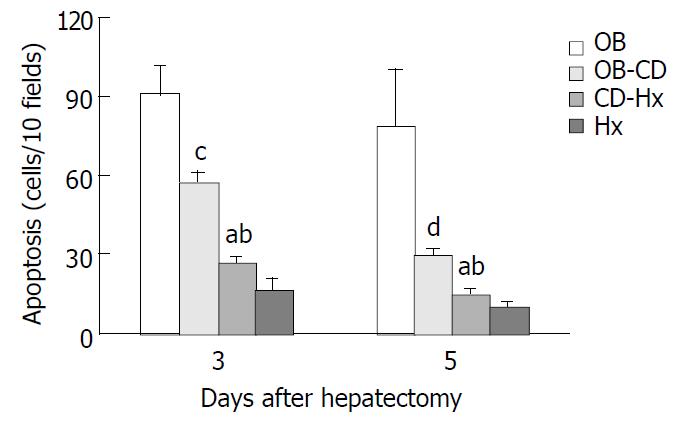
Figure 5 Changes of hepatocellular apoptotic index after hepatectomy.
Morphometric analysis of the positive cells in tissue stained by TUNEL method was performed under high power magnification (×400) in a blinded fashion. Each group consisted of 6 rats. The number of positive cells was counted and expressed as the total number of apoptotic cells seen in every ten high-power fields sections. Values were expressed as mean ± SEM. aP < 0.01 CD-Hx group vs OB group, bP < 0.01 CD-Hx group vs OB-CD group, cP < 0.05 OB-CD group vs OB group, dP < 0.01 OB-CD group vs OB group.
- Citation: Wang DS, Dou KF, Li KZ, Gao ZQ, Song ZS, Liu ZC. Hepatocellular apoptosis after hepatectomy in obstructive jaundice in rats. World J Gastroenterol 2003; 9(12): 2737-2741
- URL: https://www.wjgnet.com/1007-9327/full/v9/i12/2737.htm
- DOI: https://dx.doi.org/10.3748/wjg.v9.i12.2737


