Copyright
©The Author(s) 2025.
World J Gastroenterol. Aug 14, 2025; 31(30): 110401
Published online Aug 14, 2025. doi: 10.3748/wjg.v31.i30.110401
Published online Aug 14, 2025. doi: 10.3748/wjg.v31.i30.110401
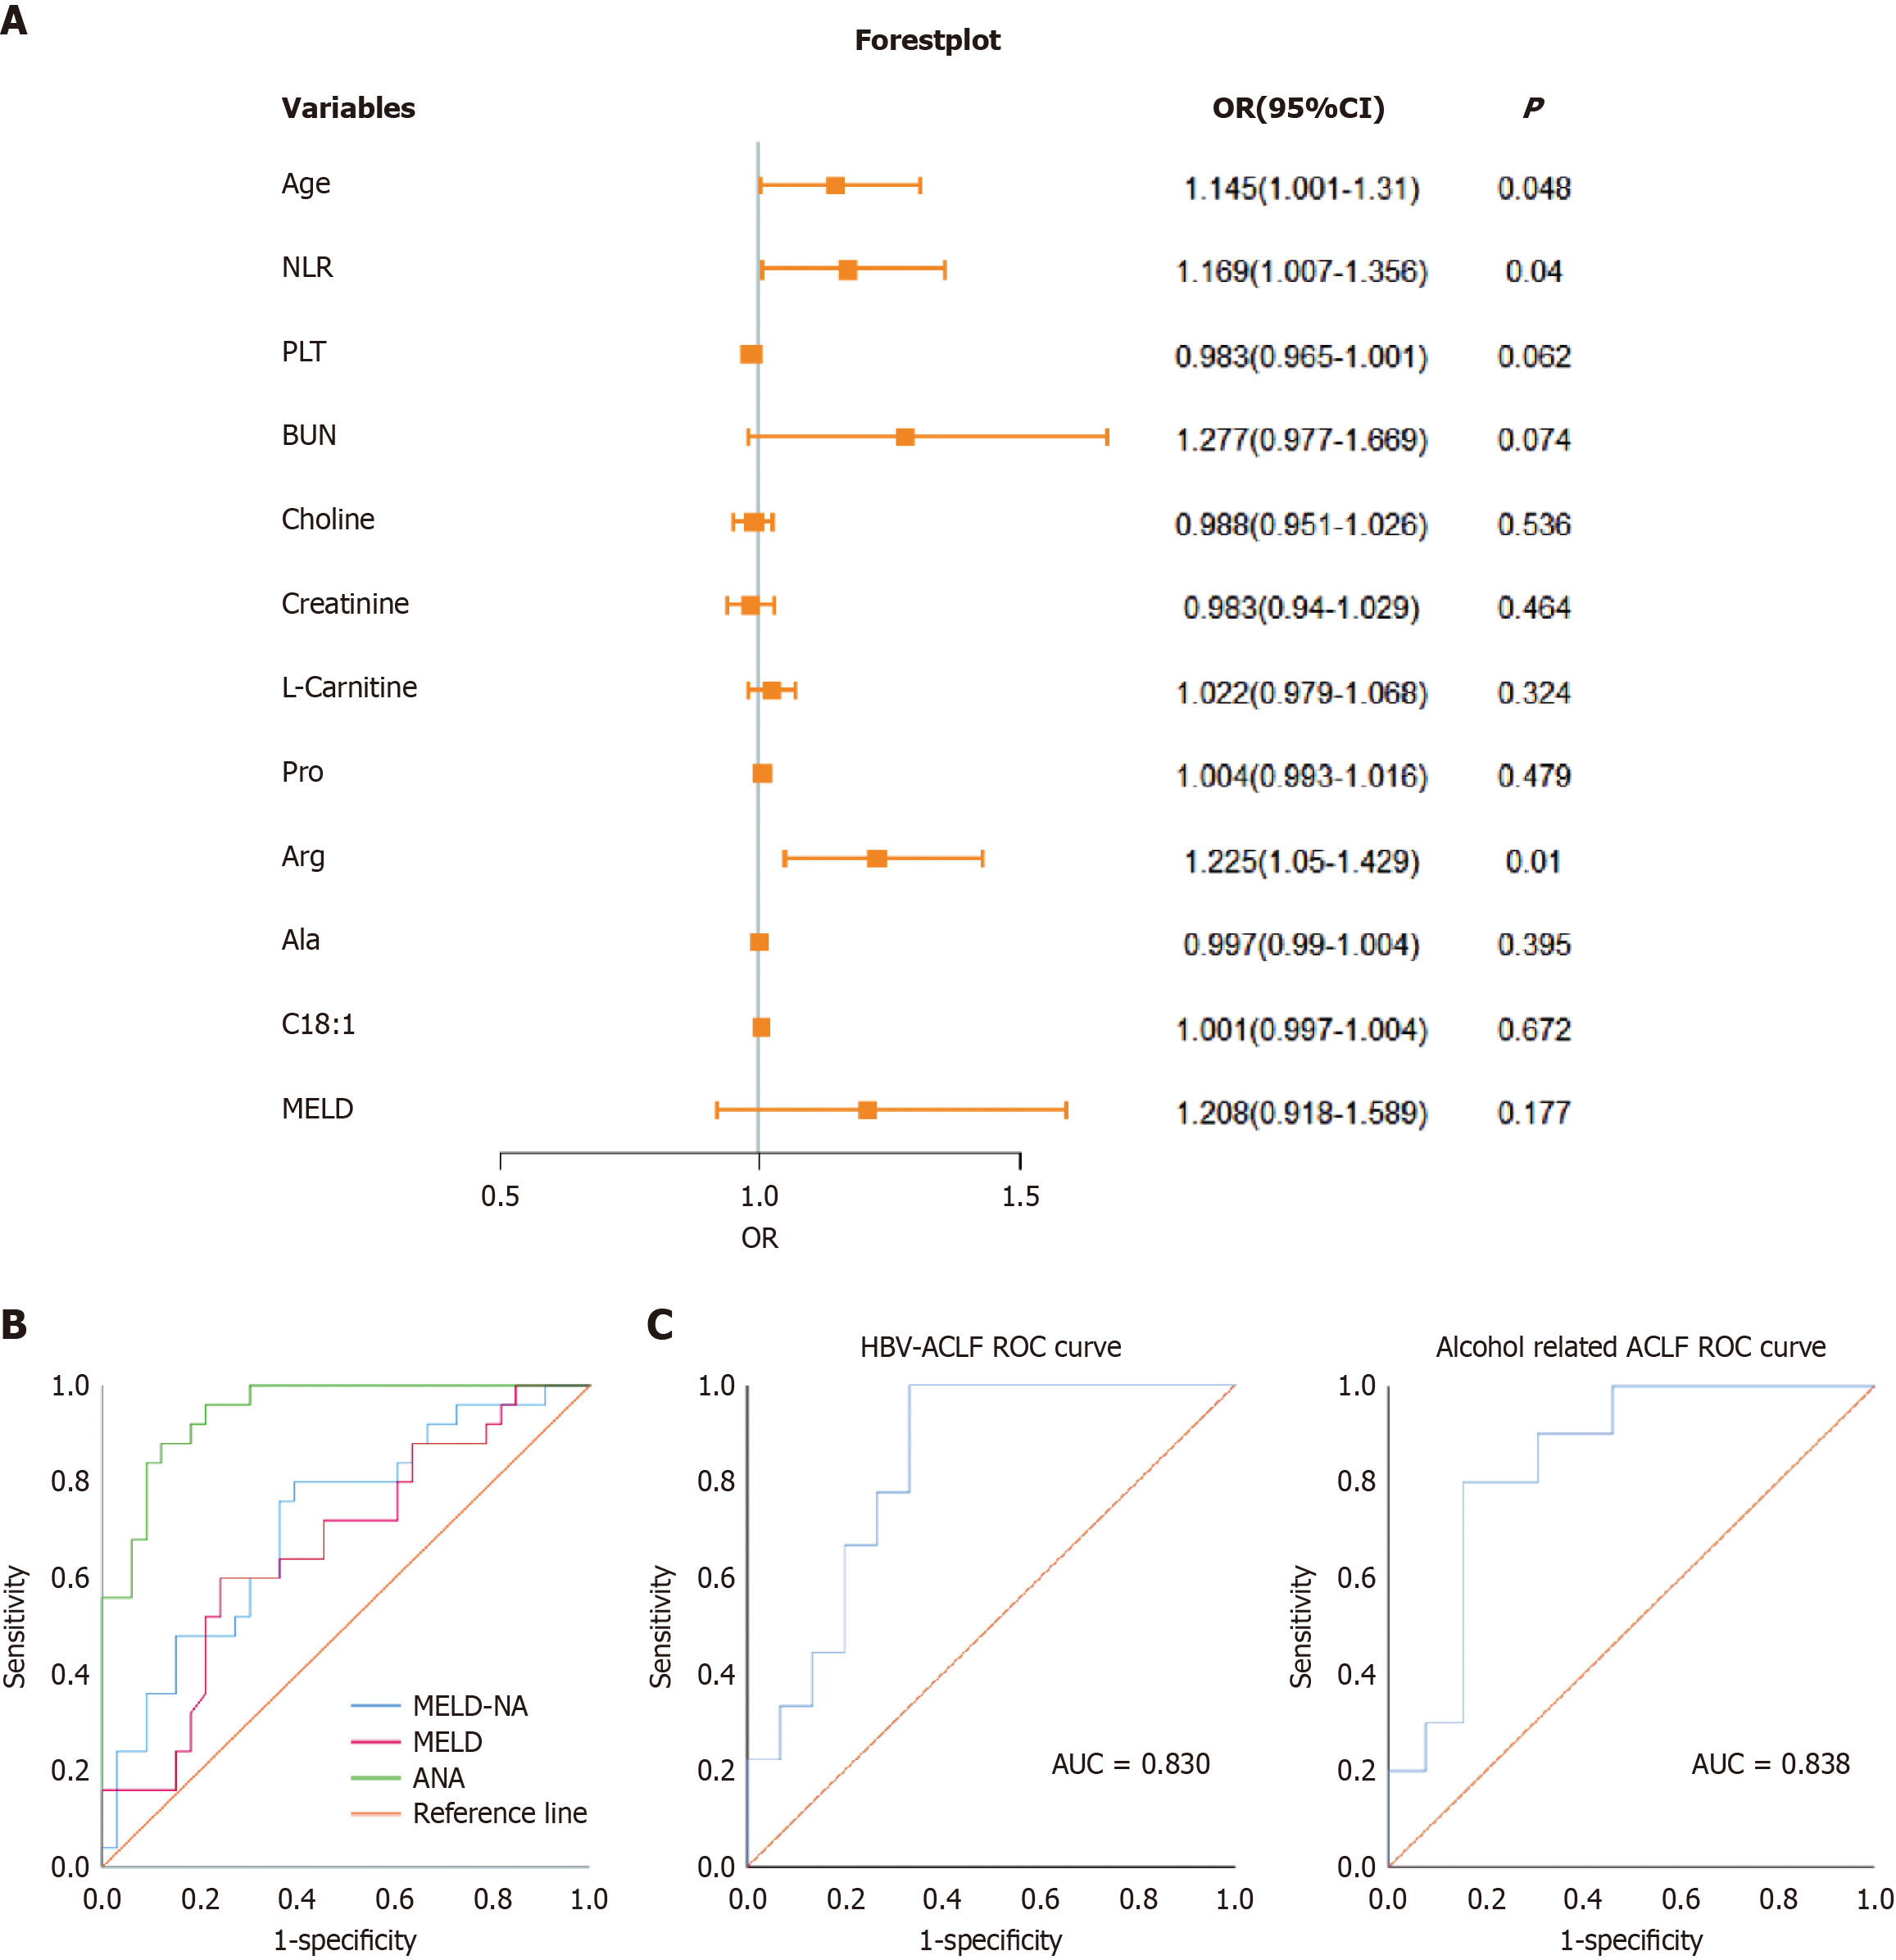
Figure 2 Logistic regression forest plot and receiver operating characteristic curve analysis.
A: Logistic regression forest plot, where the reference line (odds ratio = 1) indicates no statistical significance. B: Receiver operating characteristic curve areas under the curve for the model for end-stage liver disease, model for end-stage liver disease with sodium, and age-neutrophil-to-lymphocyte ratio-Arg models predicting 90-day mortality in 58 patients with acute-on-chronic liver failure; C: Receiver operating characteristic curve areas under the curve of the age-neutrophil-to-lymphocyte ratio-arginine for predicting 90-day mortality in hepatitis B virus-acute-on-chronic liver failure and alcohol-related acute-on-chronic liver failure patients. NLR: Neutrophil-to-lymphocyte ratio; PLT: Platelet; BUN: Blood urea nitrogen; ANA: Age-neutrophil-to-lymphocyte ratio-arginine; HBV: Hepatitis B virus; AUC: Area under curve; Ala: Alanine; Arg: Arginine; Pro: Proline; C18:1: Oleic acid; ROC: Receiver operating characteristic; MELD: Model for end-stage liver disease; MELD-Na: Model for end-stage liver disease with sodium; ACLF: Acute-on-chronic liver failure.
- Citation: Liu Y, Xiao Y, Ai LF, Zhang JJ, Zhang JD, Qi ZQ, Dong L, Wang YD. Serum metabolomic characteristics and their predictive value for ninety-day prognosis in patients with acute-on-chronic liver failure. World J Gastroenterol 2025; 31(30): 110401
- URL: https://www.wjgnet.com/1007-9327/full/v31/i30/110401.htm
- DOI: https://dx.doi.org/10.3748/wjg.v31.i30.110401


