Copyright
©The Author(s) 2025.
World J Gastroenterol. May 21, 2025; 31(19): 104897
Published online May 21, 2025. doi: 10.3748/wjg.v31.i19.104897
Published online May 21, 2025. doi: 10.3748/wjg.v31.i19.104897
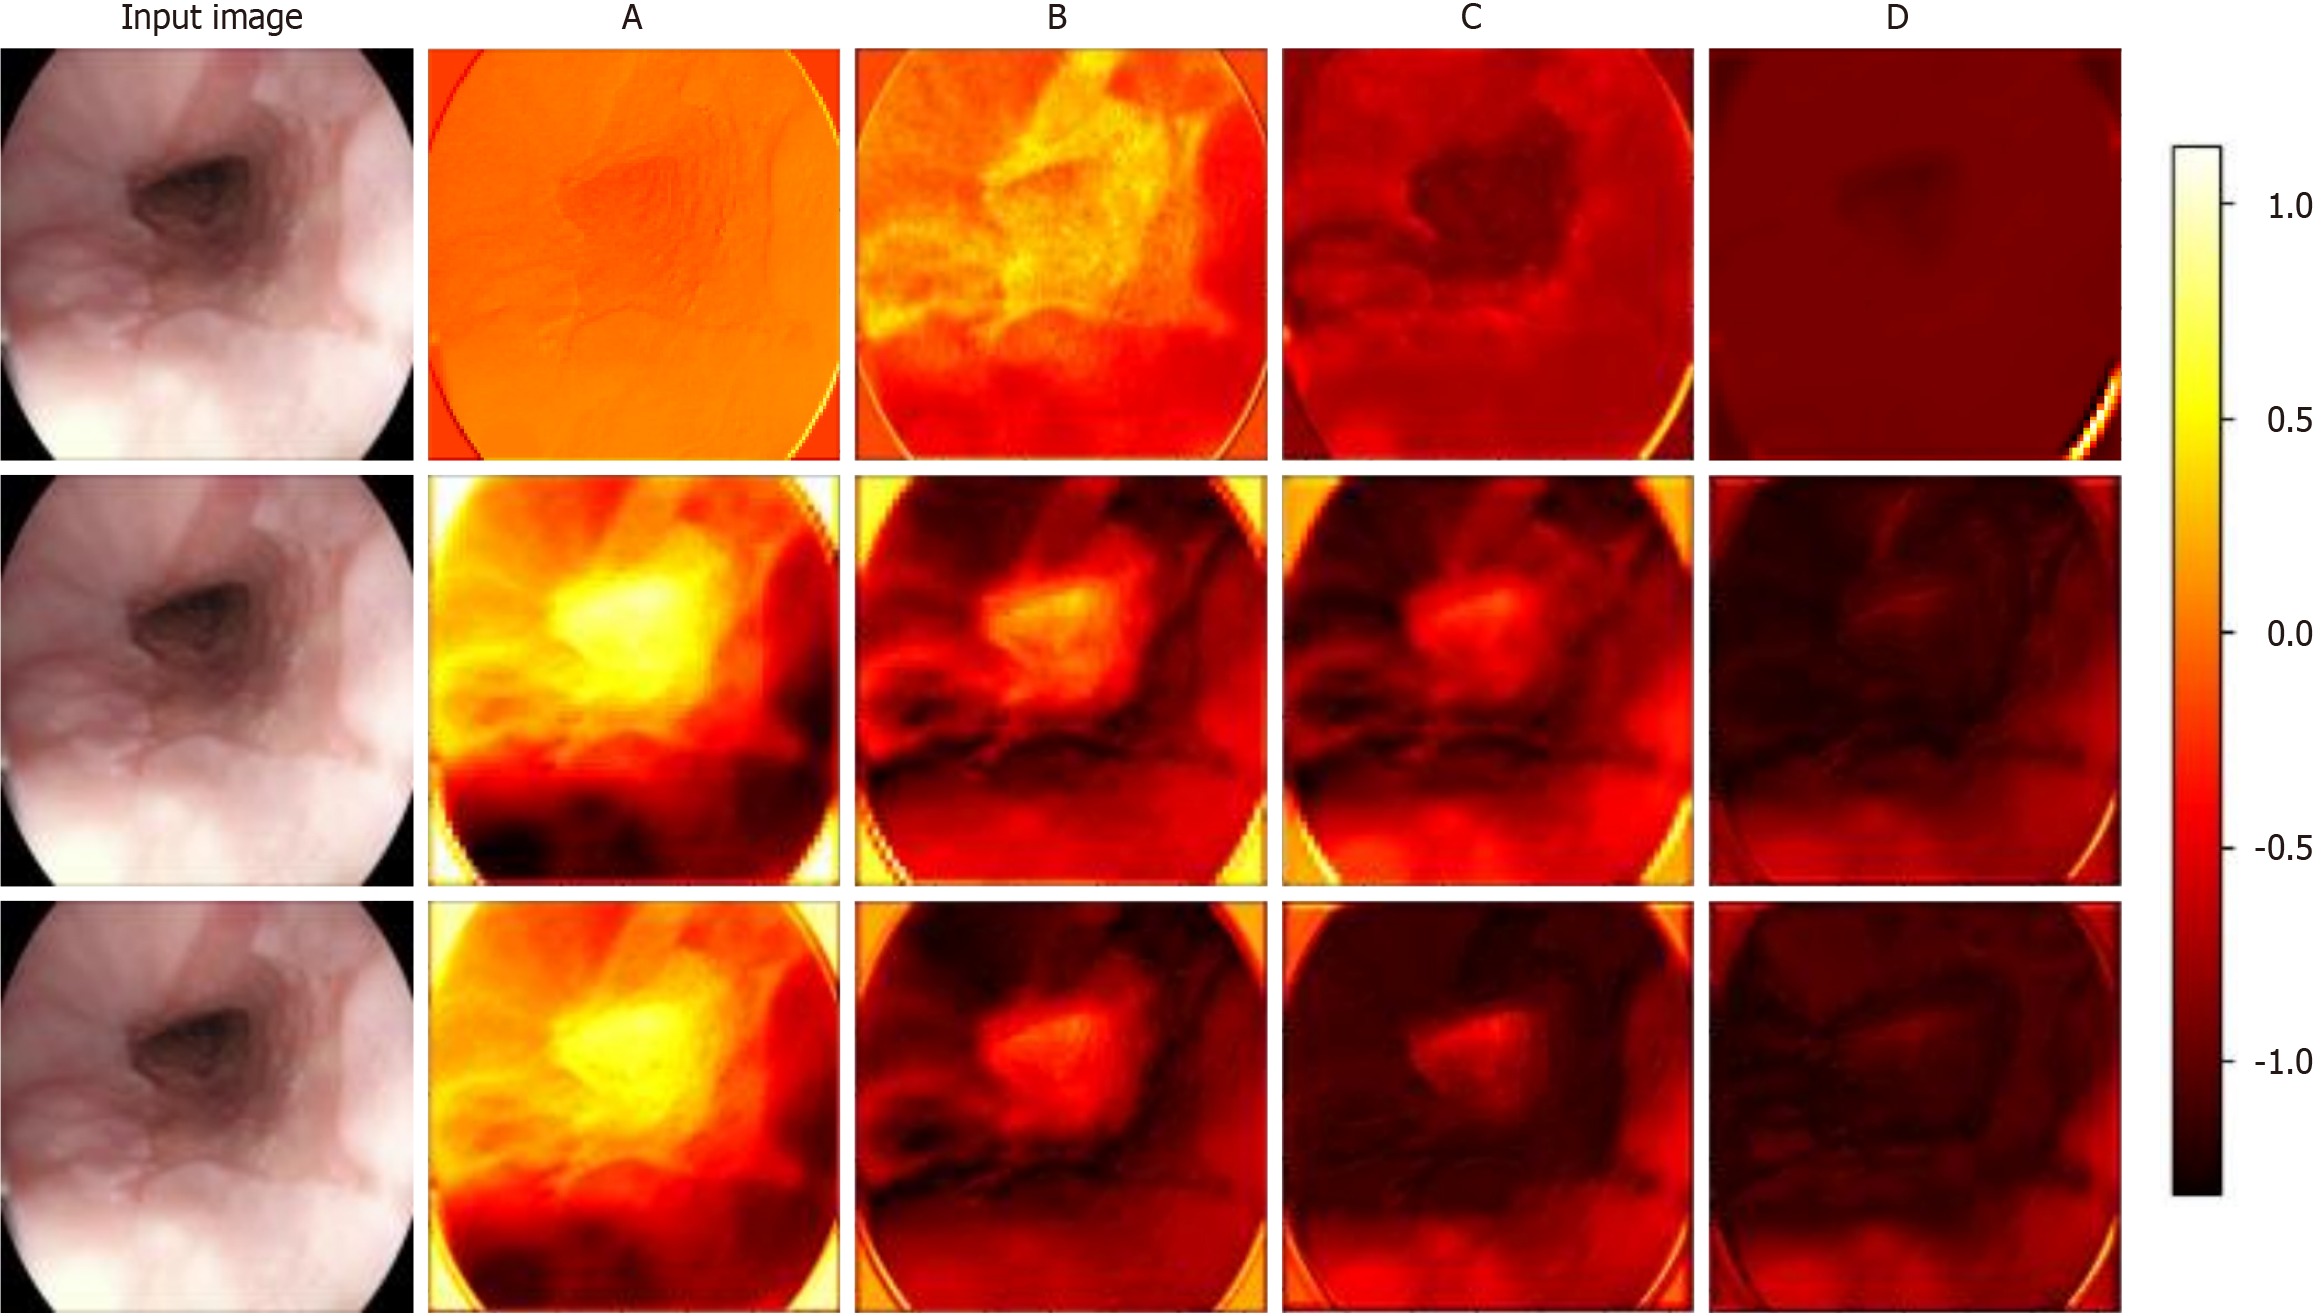
Figure 7 Visualization of feature extraction from different layers in the prognostic model.
The first to third rows correspond to the feature maps extracted by the bottleneck block in residual network, the transformer block in the transformer model, and the wavelet block in Wave-Vision Transformer (Wave-ViT), respectively. A-D: The feature maps extracted by the four different levels of modules illustrated in Supplementary Figure 1. This visualization provides an intuitive comparison of the feature extraction capabilities of the three models. The contrast in feature maps clearly reveals Wave-ViT’s advantage in multi-scale feature extraction, particularly in its balance between detail and global information. These results support Wave-ViT’s superiority in medical imaging analysis, particularly in esophageal cancer diagnosis, where it more accurately detects early-stage lesions and complex pathological features. This visualization validates Wave-ViT’s architectural design and provides critical insights for further model optimization[23].
- Citation: Wei W, Zhang XL, Wang HZ, Wang LL, Wen JL, Han X, Liu Q. Application of deep learning models in the pathological classification and staging of esophageal cancer: A focus on Wave-Vision Transformer. World J Gastroenterol 2025; 31(19): 104897
- URL: https://www.wjgnet.com/1007-9327/full/v31/i19/104897.htm
- DOI: https://dx.doi.org/10.3748/wjg.v31.i19.104897


