Copyright
©The Author(s) 2024.
World J Gastroenterol. Mar 7, 2024; 30(9): 1224-1236
Published online Mar 7, 2024. doi: 10.3748/wjg.v30.i9.1224
Published online Mar 7, 2024. doi: 10.3748/wjg.v30.i9.1224
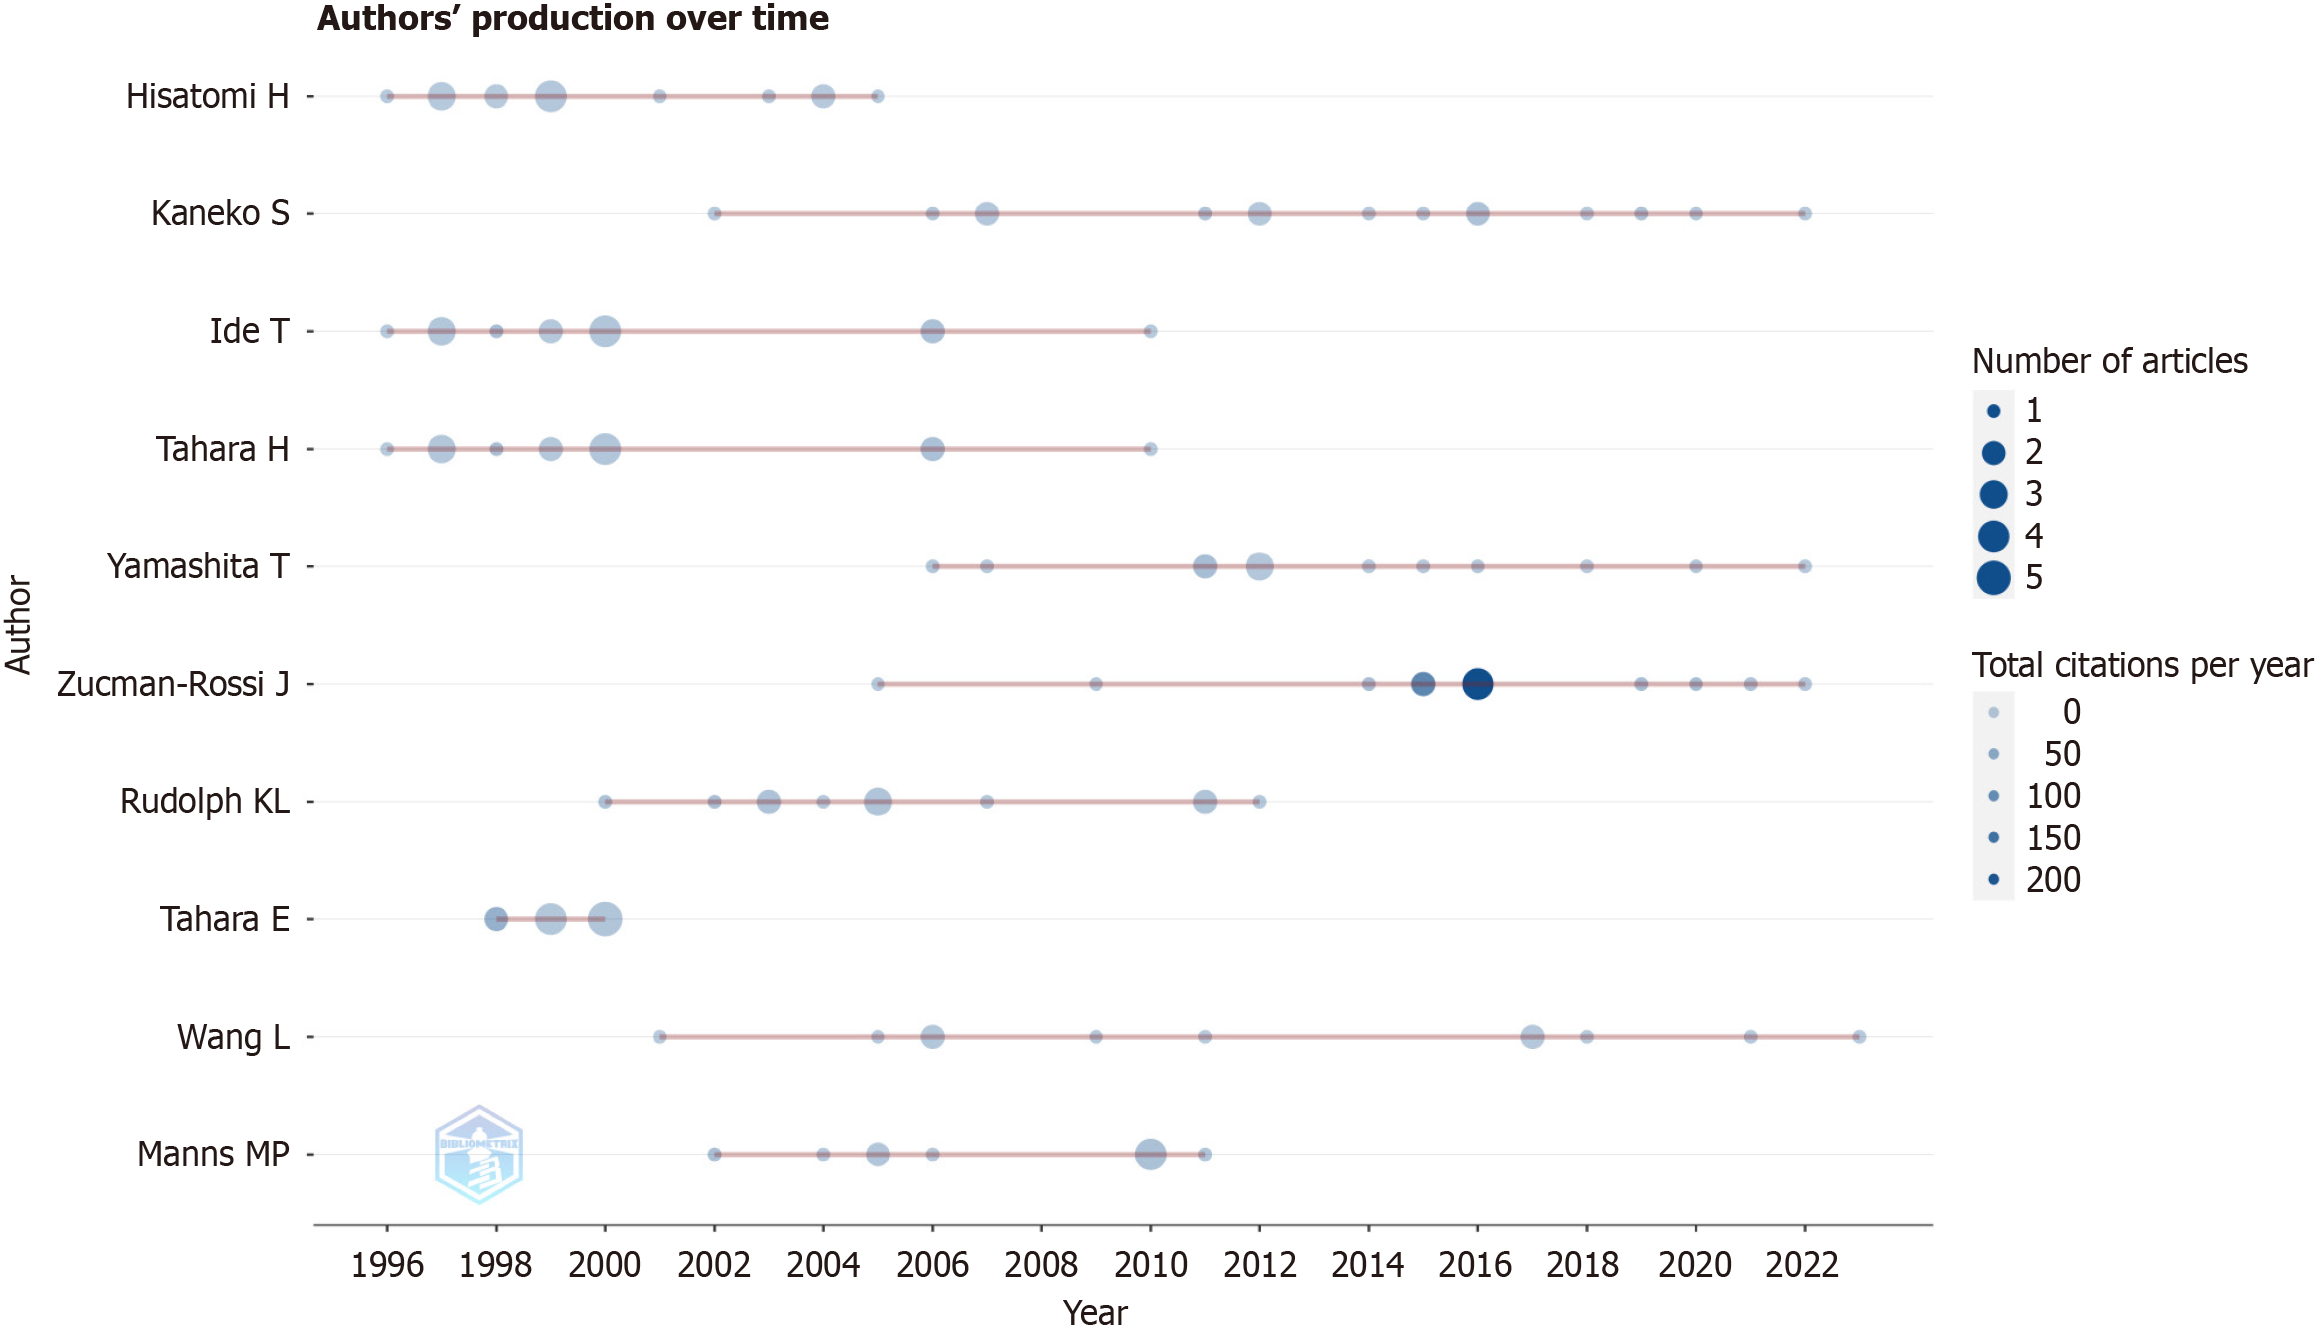
Figure 3 Top authors’ production over time.
This graph illustrates the production of top authors over time, where the size of each node corresponds to the total number of articles produced. The color of the nodes indicates the average number of citations each document received per year.
- Citation: Li HY, Zheng LL, Hu N, Wang ZH, Tao CC, Wang YR, Liu Y, Aizimuaji Z, Wang HW, Zheng RQ, Xiao T, Rong WQ. Telomerase-related advances in hepatocellular carcinoma: A bibliometric and visual analysis. World J Gastroenterol 2024; 30(9): 1224-1236
- URL: https://www.wjgnet.com/1007-9327/full/v30/i9/1224.htm
- DOI: https://dx.doi.org/10.3748/wjg.v30.i9.1224


