Copyright
©The Author(s) 2023.
World J Gastroenterol. Jan 7, 2023; 29(1): 190-199
Published online Jan 7, 2023. doi: 10.3748/wjg.v29.i1.190
Published online Jan 7, 2023. doi: 10.3748/wjg.v29.i1.190
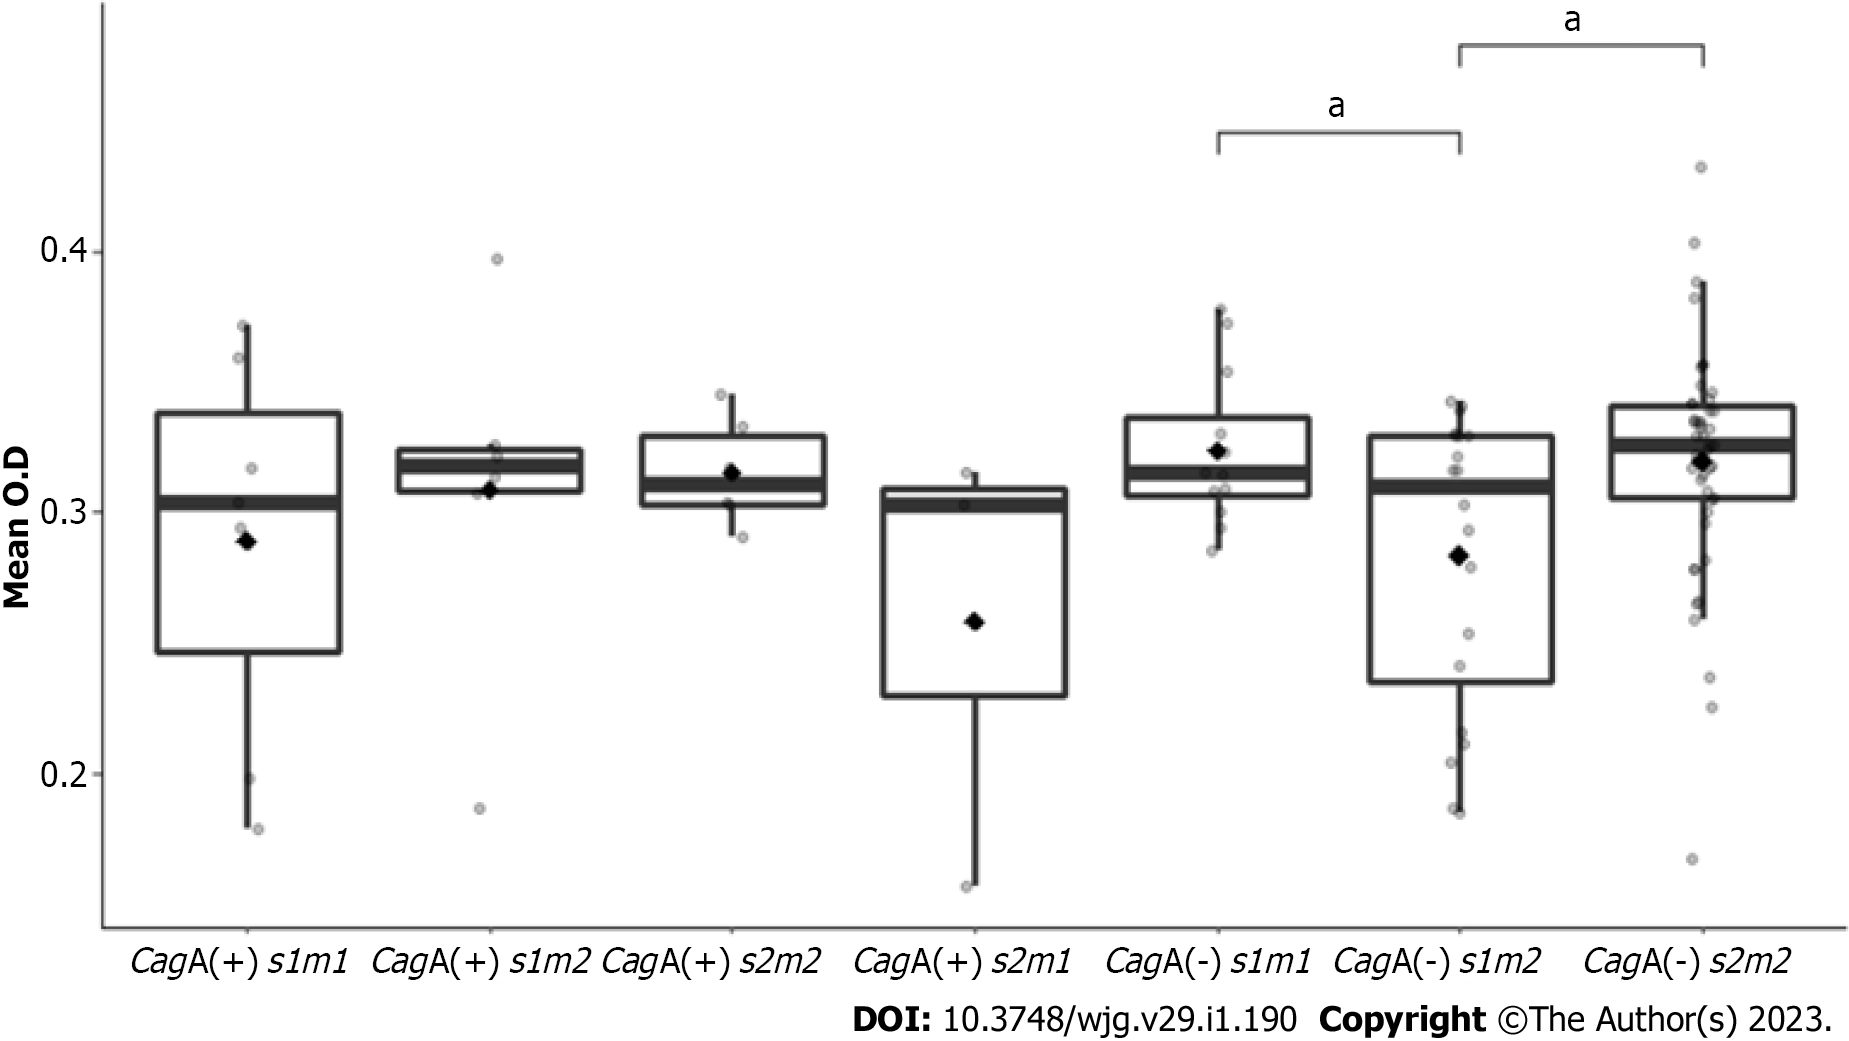
Figure 3 Urease activity as a function of isolate genotype combination.
Urease activity was measured 1 min, 5 min, and 10 min after incubation of bacteria with urea solution, as described in the Materials and Methods section. The minimal, maximal, and median of mean urease activity values are shown (the median is indicated by the line within the bar) per each group of isolates with a different genotype of cytotoxin-associated gene A and vacuolating cytotoxin A genes. O.D: Optical density; VacA: Vacuolating cytotoxin A; CagA: Cytotoxin-associated gene A. aP < 0.05.
- Citation: Roshrosh H, Rohana H, Azrad M, Leshem T, Masaphy S, Peretz A. Impact of Helicobacter pylori virulence markers on clinical outcomes in adult populations. World J Gastroenterol 2023; 29(1): 190-199
- URL: https://www.wjgnet.com/1007-9327/full/v29/i1/190.htm
- DOI: https://dx.doi.org/10.3748/wjg.v29.i1.190


