Copyright
©The Author(s) 2022.
World J Gastroenterol. Apr 7, 2022; 28(13): 1338-1346
Published online Apr 7, 2022. doi: 10.3748/wjg.v28.i13.1338
Published online Apr 7, 2022. doi: 10.3748/wjg.v28.i13.1338
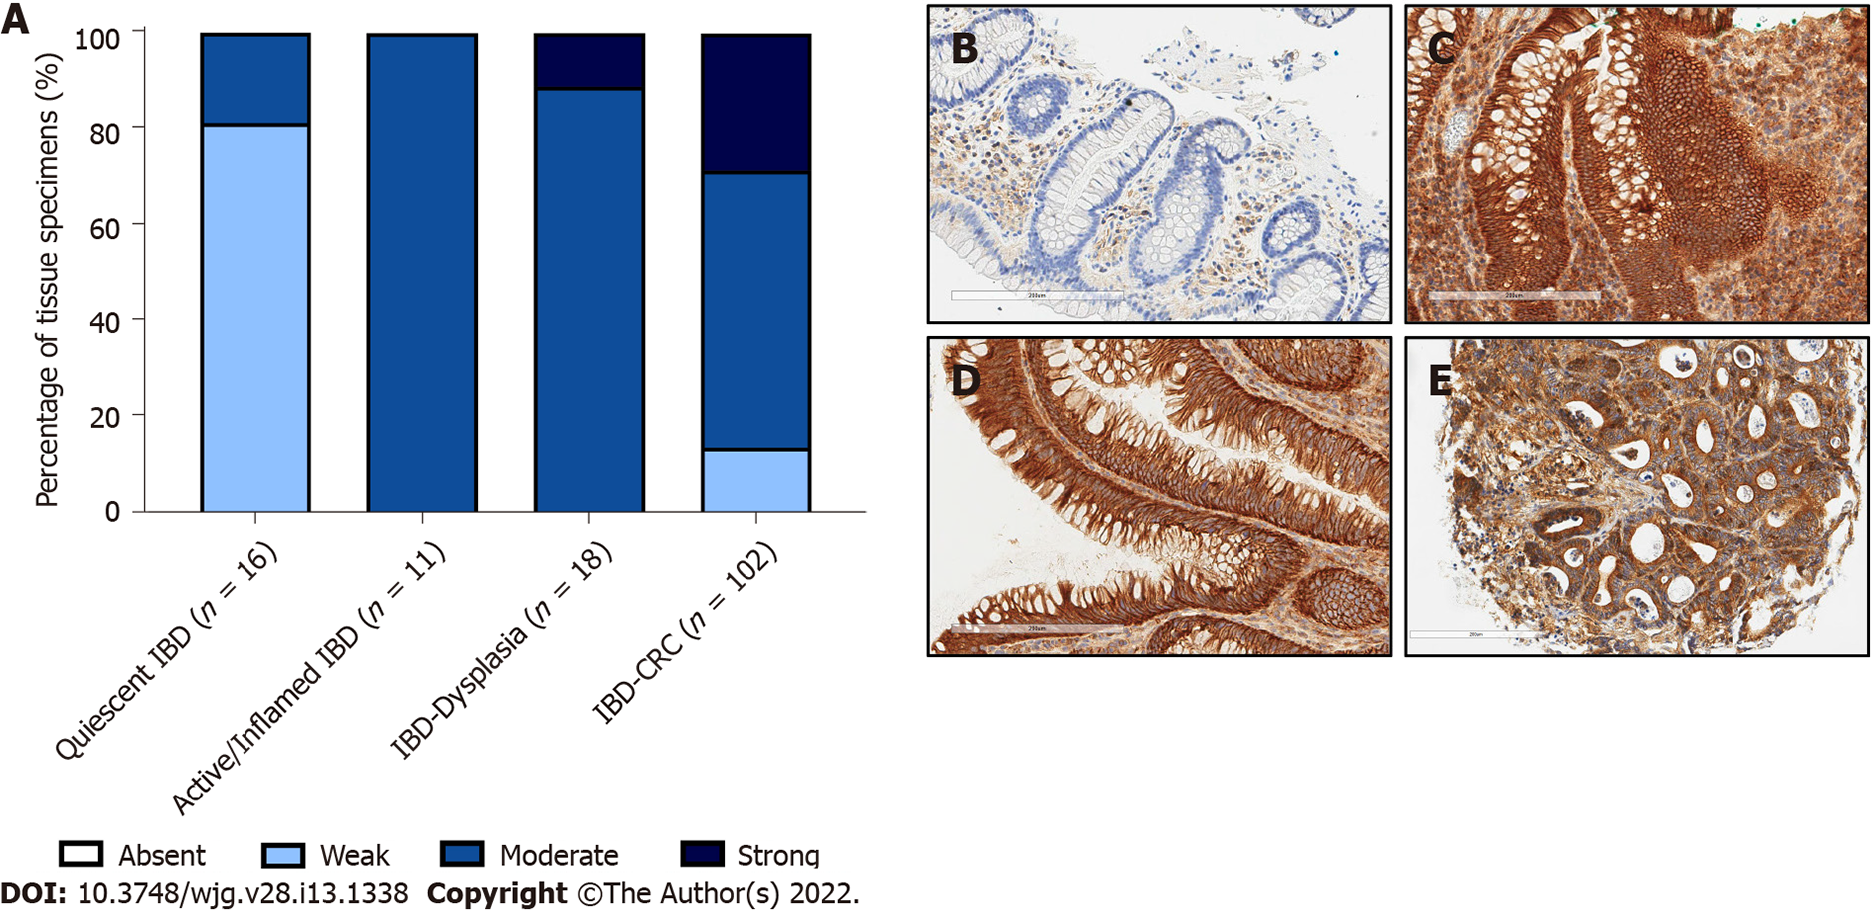
Figure 2 Expression intensity of c-MET in inflammatory bowel disease-associated lesions.
A: Semi-quantitative assessment of c-MET expression intensity throughout inflammatory bowel disease (IBD)-associated colorectal carcinogenesis; B: Representative photomicrograph of quiescent IBD mucosa; C: Representative photomicrograph of active/inflamed IBD mucosa; D: Representative photomicrograph of IBD-associated dysplastic lesions; E: Representative photomicrograph of IBD-associated colorectal cancer. Tissue provided by Lothian NRS Bioresource. Brightfield photomicrographs taken at X20 magnification. IBD: Inflammatory bowel disease; CRC: Colorectal cancer.
- Citation: Halliday G, Porter RJ, Black CJ, Arends MJ, Din S. c-MET immunohistochemical expression in sporadic and inflammatory bowel disease associated lesions. World J Gastroenterol 2022; 28(13): 1338-1346
- URL: https://www.wjgnet.com/1007-9327/full/v28/i13/1338.htm
- DOI: https://dx.doi.org/10.3748/wjg.v28.i13.1338


