Copyright
©The Author(s) 2021.
World J Gastroenterol. Oct 28, 2021; 27(40): 6888-6907
Published online Oct 28, 2021. doi: 10.3748/wjg.v27.i40.6888
Published online Oct 28, 2021. doi: 10.3748/wjg.v27.i40.6888
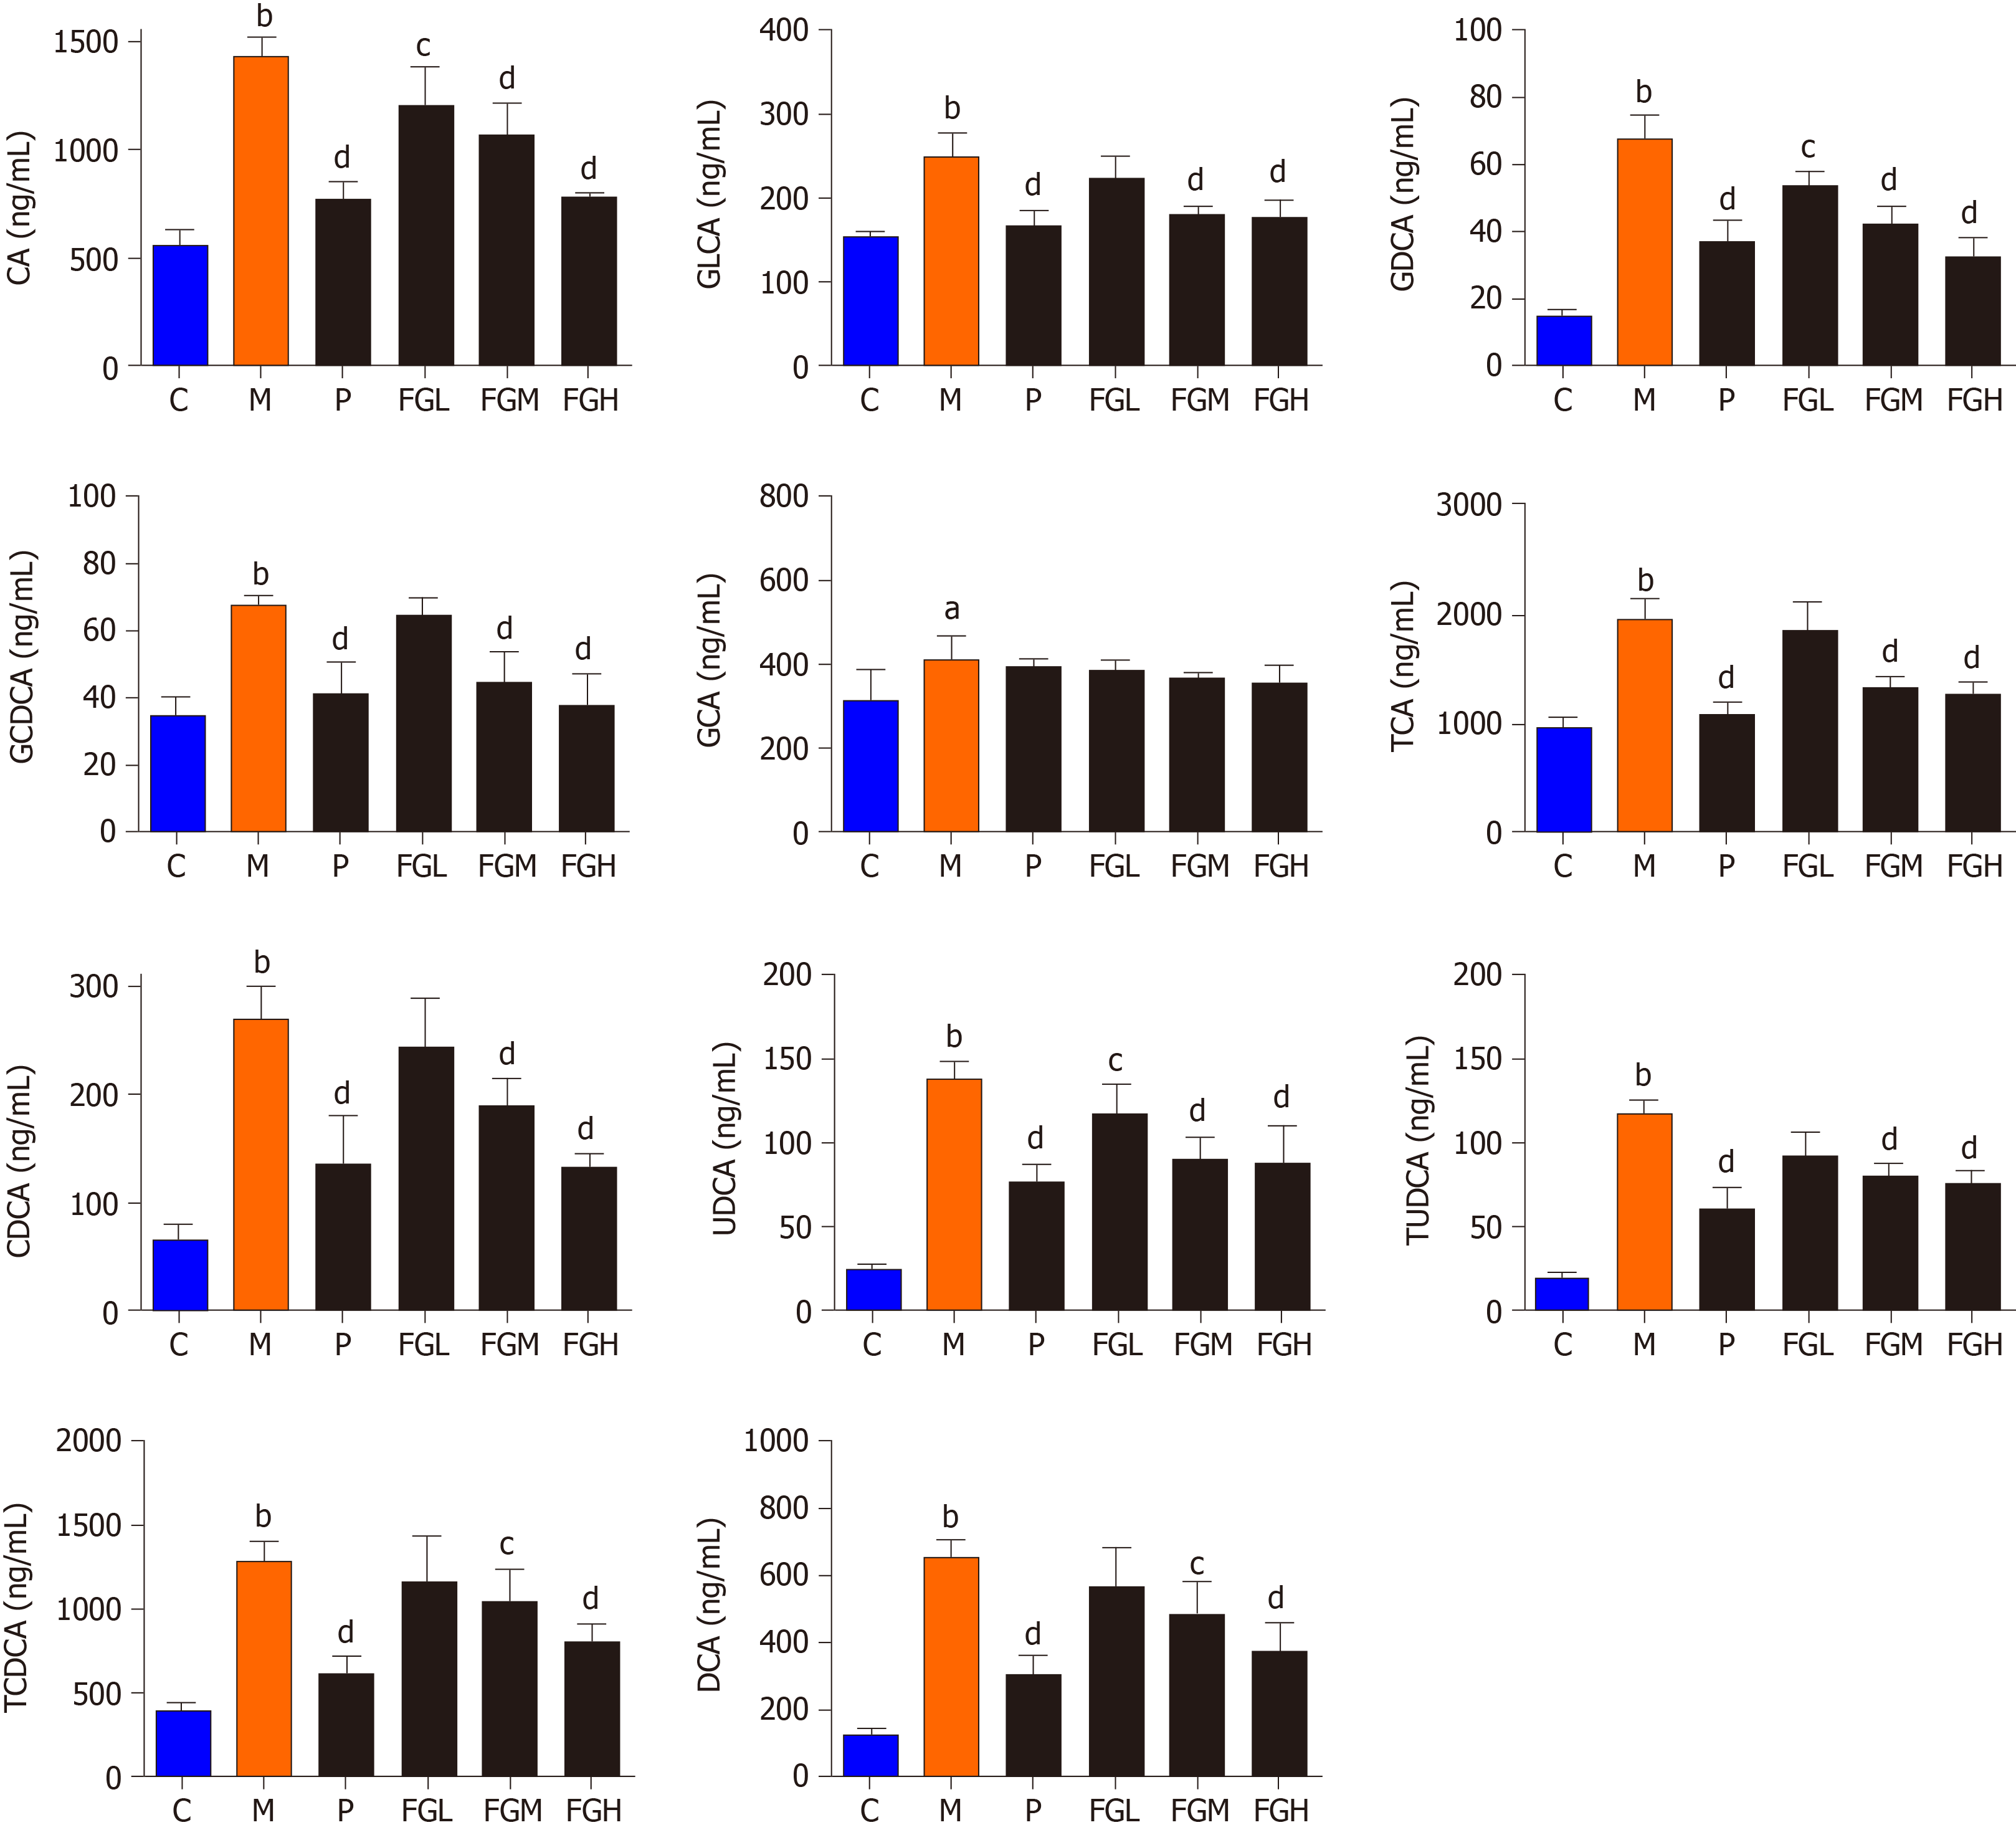
Figure 4 Bile acids in rats (n = 6, mean ± SD).
aP < 0.05, bP < 0.01 for each treatment group and model control group, respectively; cP < 0.05, dP < 0.01 for the model control group and normal control group, respectively.
- Citation: Wang MF, Zhao SS, Thapa DM, Song YL, Xiang Z. Metabolomics of Fuzi-Gancao in CCl4 induced acute liver injury and its regulatory effect on bile acid profile in rats. World J Gastroenterol 2021; 27(40): 6888-6907
- URL: https://www.wjgnet.com/1007-9327/full/v27/i40/6888.htm
- DOI: https://dx.doi.org/10.3748/wjg.v27.i40.6888


