Copyright
©The Author(s) 2021.
World J Gastroenterol. Apr 21, 2021; 27(15): 1616-1629
Published online Apr 21, 2021. doi: 10.3748/wjg.v27.i15.1616
Published online Apr 21, 2021. doi: 10.3748/wjg.v27.i15.1616
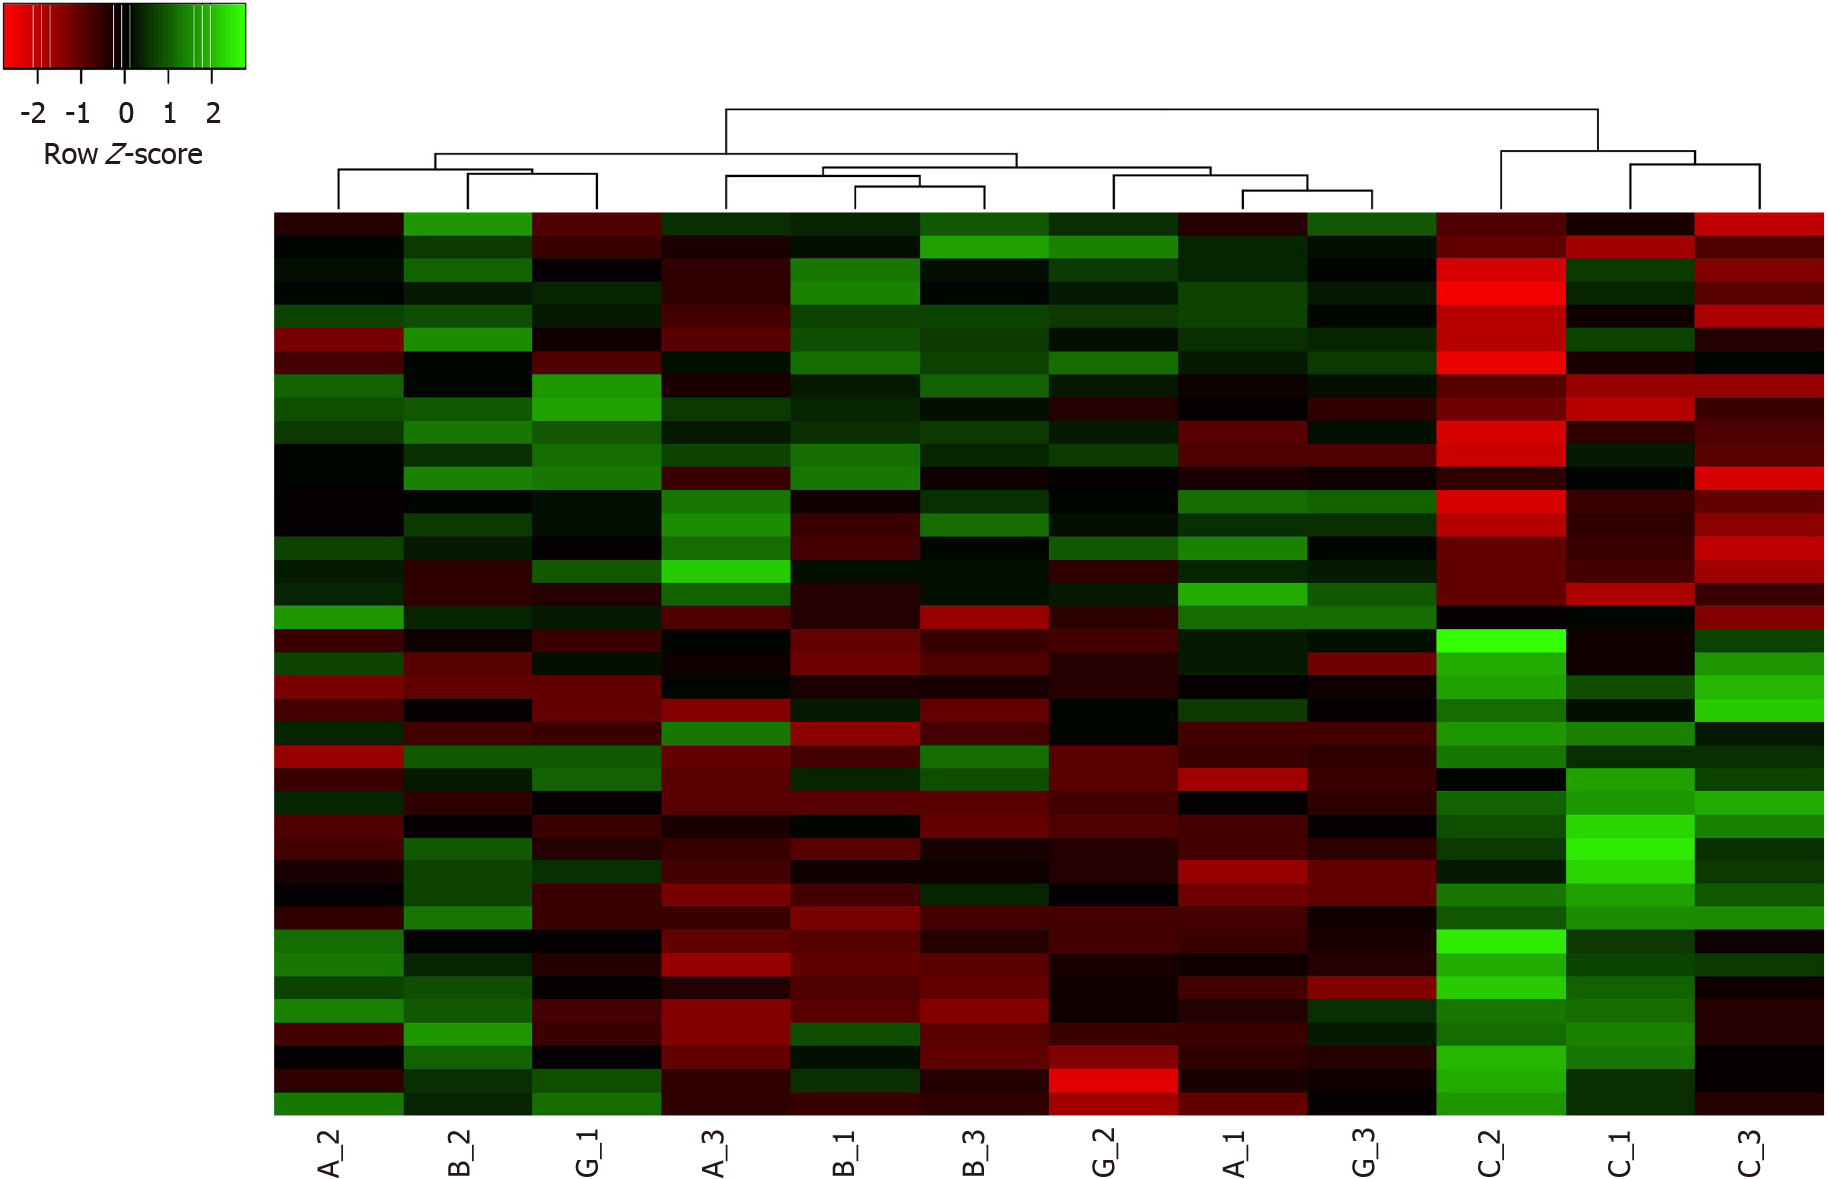
Figure 1 Hierarchical cluster heatmap of treated (α, β and γ isoforms) and control (C1, C2, C3) samples based on the obtained differentially expressed genes.
Distance measurement method: Pearson; Clustering method: Average linkage.
- Citation: Cecati M, Giulietti M, Righetti A, Sabanovic B, Piva F. Effects of CXCL12 isoforms in a pancreatic pre-tumour cellular model: Microarray analysis. World J Gastroenterol 2021; 27(15): 1616-1629
- URL: https://www.wjgnet.com/1007-9327/full/v27/i15/1616.htm
- DOI: https://dx.doi.org/10.3748/wjg.v27.i15.1616


