Copyright
©The Author(s) 2020.
World J Gastroenterol. Dec 28, 2020; 26(48): 7679-7692
Published online Dec 28, 2020. doi: 10.3748/wjg.v26.i48.7679
Published online Dec 28, 2020. doi: 10.3748/wjg.v26.i48.7679
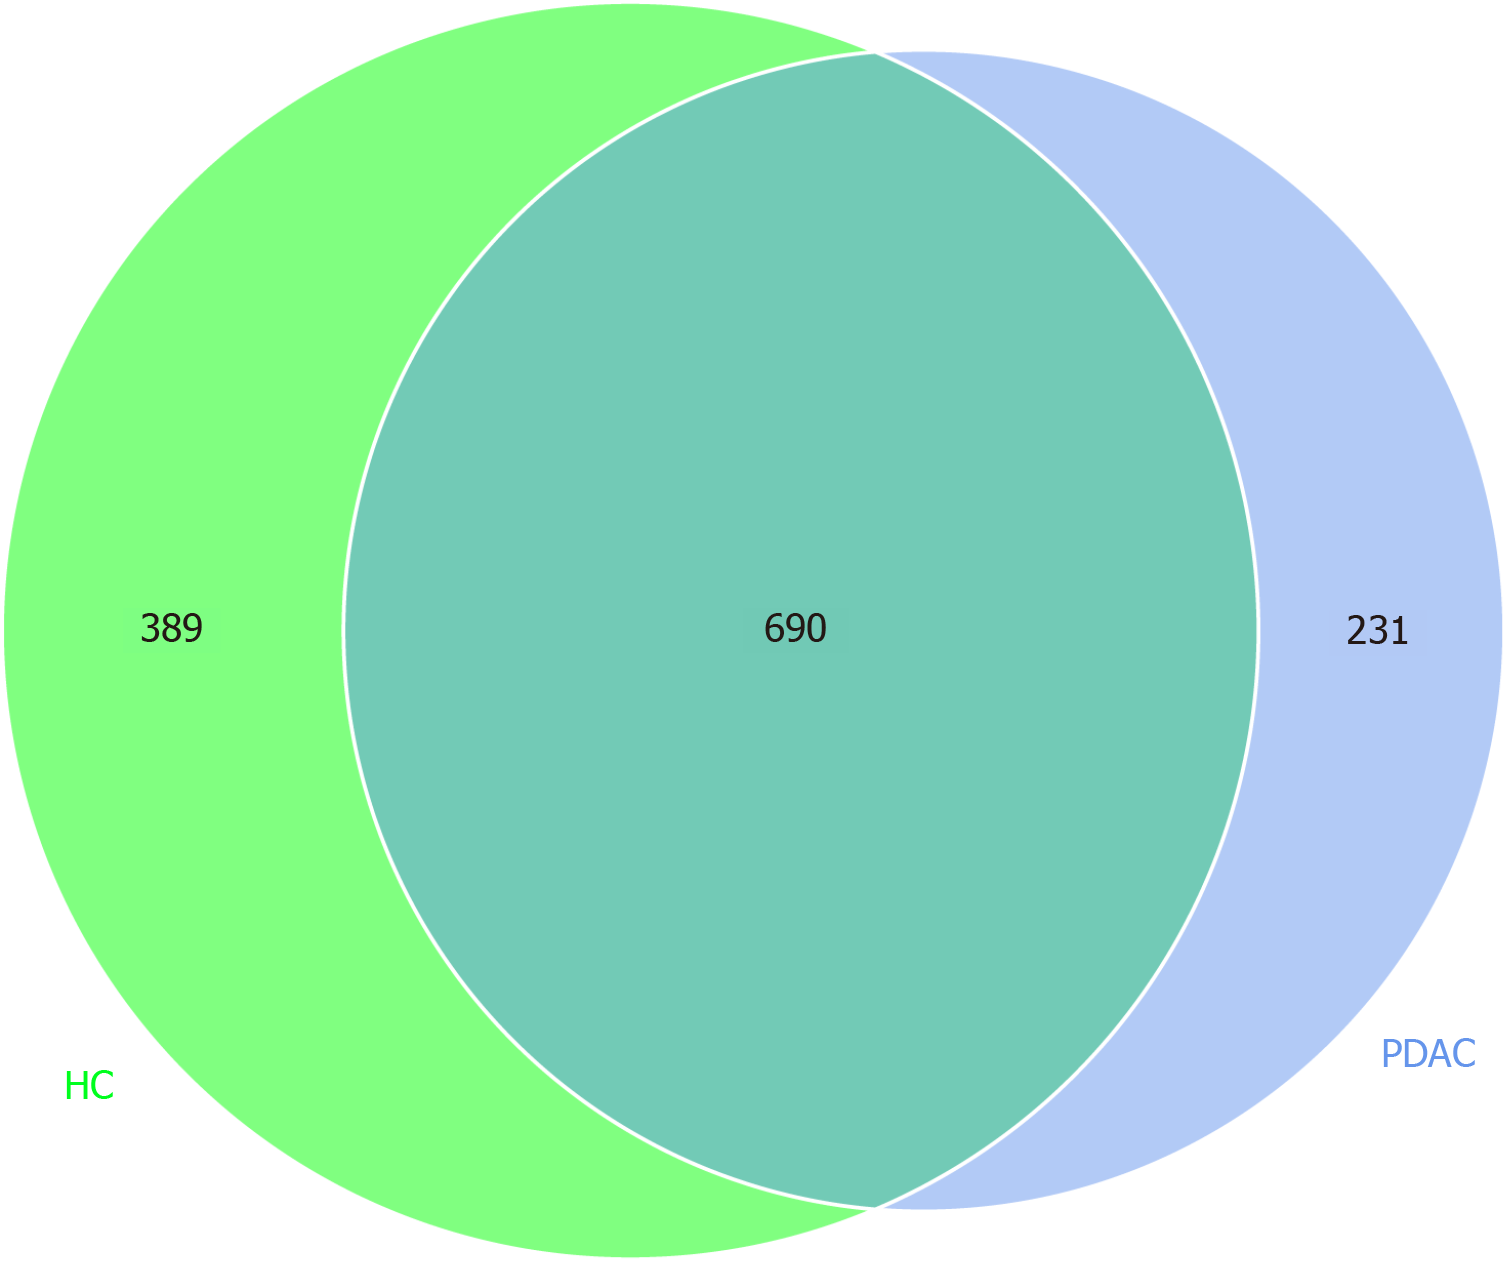
Figure 1 Microbial profiles of two groups.
Venn diagram showing shared and unique operational taxonomic units (OTUs) at 97% identity among pancreatic adenocarcinoma (PDAC) group (n = 41) and healthy controls (HC) group (n = 69). PDAC group is blue; HC group is green. OTUs (690) are shared by two groups. Unique OTUs of 231 and 389 were found in PDAC and HC, respectively.
- Citation: Wei AL, Li M, Li GQ, Wang X, Hu WM, Li ZL, Yuan J, Liu HY, Zhou LL, Li K, Li A, Fu MR. Oral microbiome and pancreatic cancer. World J Gastroenterol 2020; 26(48): 7679-7692
- URL: https://www.wjgnet.com/1007-9327/full/v26/i48/7679.htm
- DOI: https://dx.doi.org/10.3748/wjg.v26.i48.7679


