Copyright
©The Author(s) 2020.
World J Gastroenterol. Oct 21, 2020; 26(39): 5970-5982
Published online Oct 21, 2020. doi: 10.3748/wjg.v26.i39.5970
Published online Oct 21, 2020. doi: 10.3748/wjg.v26.i39.5970
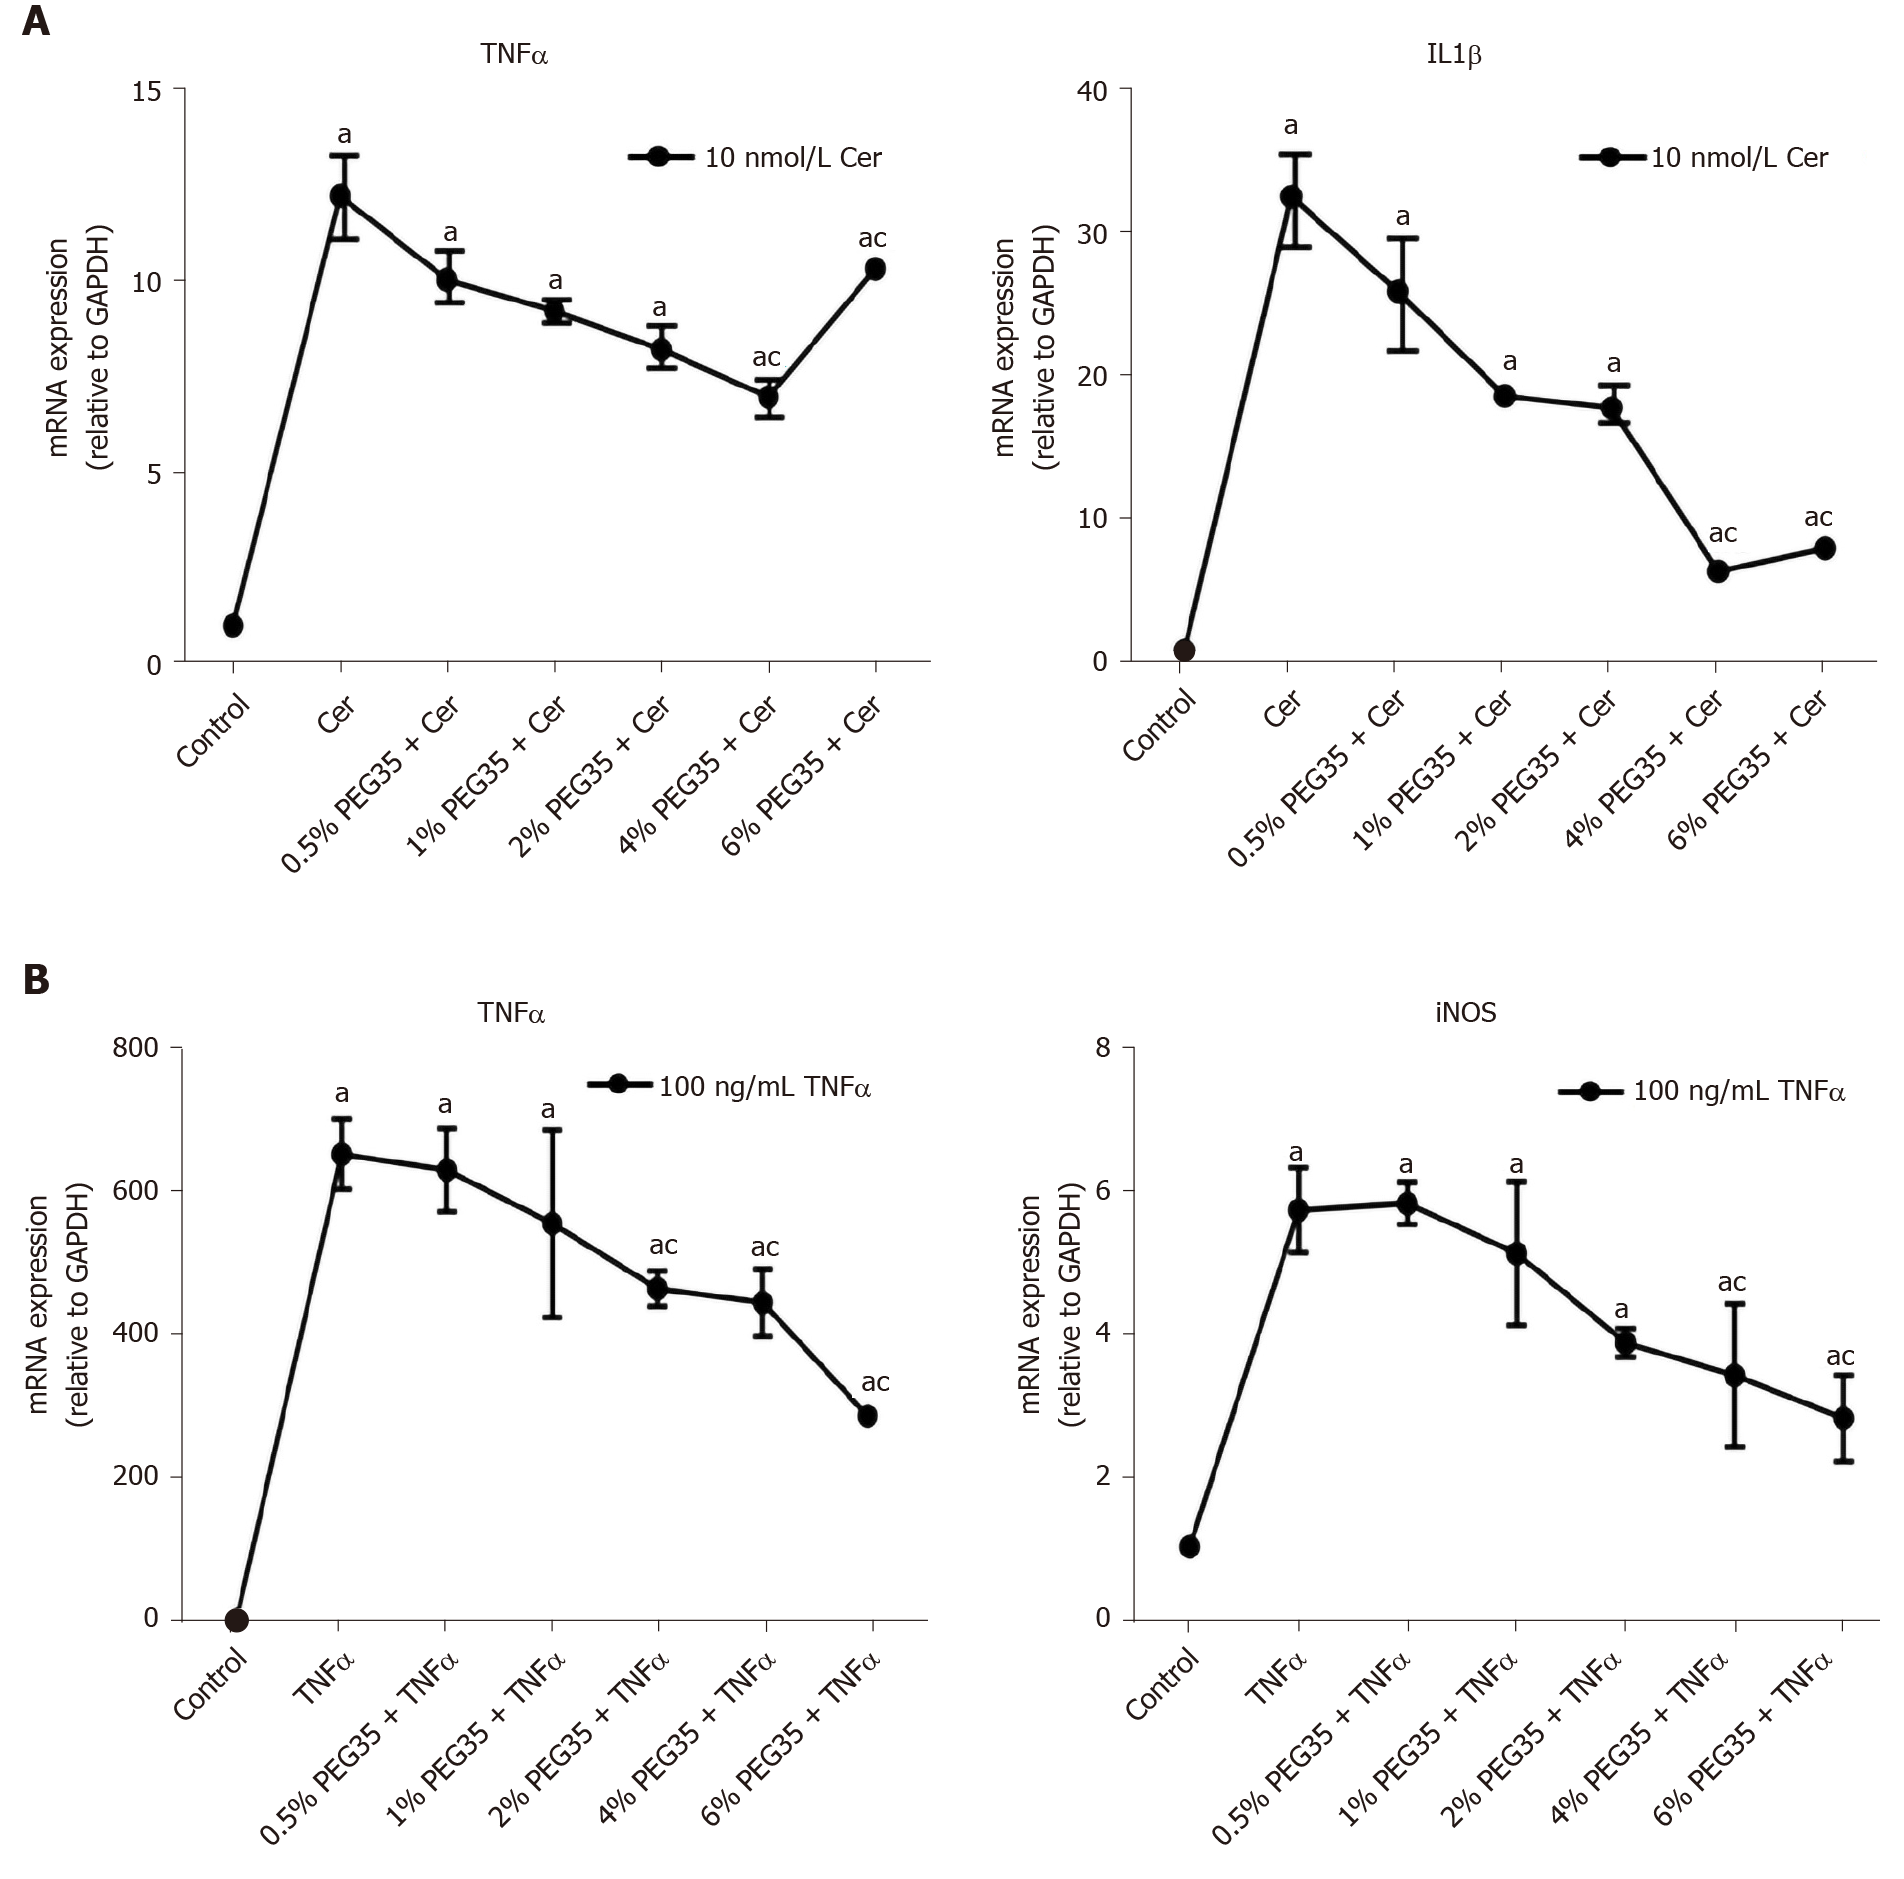
Figure 3 Gene expressions of inflammatory markers in AR42J-treated cells.
A: Gene expression by real-time qRT-PCR of tumor necrosis factor α (TNFα) and IL1β in cerulein-treated AR42J cells subjected to increasing concentrations of 35-kDa polyethylene glycol (PEG35); B: Gene expression by real-time qRT-PCR of TNFα and inducible nitric oxide synthase in TNFα-treated AR42J cells subjected to increasing concentrations of PEG35. In both cases, mRNA induction levels were normalized to GAPDH mRNA expression. Bars represent mean values of each group ± SEM. aP < 0.05 vs control, cP < 0.05 vs cerulein or TNFα. Each determination was carried out in triplicate. Cer: Cerulein; PEG35: 35-kDa polyethylene glycol; TNFα: Tumor necrosis factor α.
- Citation: Ferrero-Andrés A, Panisello-Roselló A, Roselló-Catafau J, Folch-Puy E. Polyethylene glycol 35 ameliorates pancreatic inflammatory response in cerulein-induced acute pancreatitis in rats. World J Gastroenterol 2020; 26(39): 5970-5982
- URL: https://www.wjgnet.com/1007-9327/full/v26/i39/5970.htm
- DOI: https://dx.doi.org/10.3748/wjg.v26.i39.5970


