Copyright
©The Author(s) 2020.
World J Gastroenterol. May 7, 2020; 26(17): 2097-2110
Published online May 7, 2020. doi: 10.3748/wjg.v26.i17.2097
Published online May 7, 2020. doi: 10.3748/wjg.v26.i17.2097
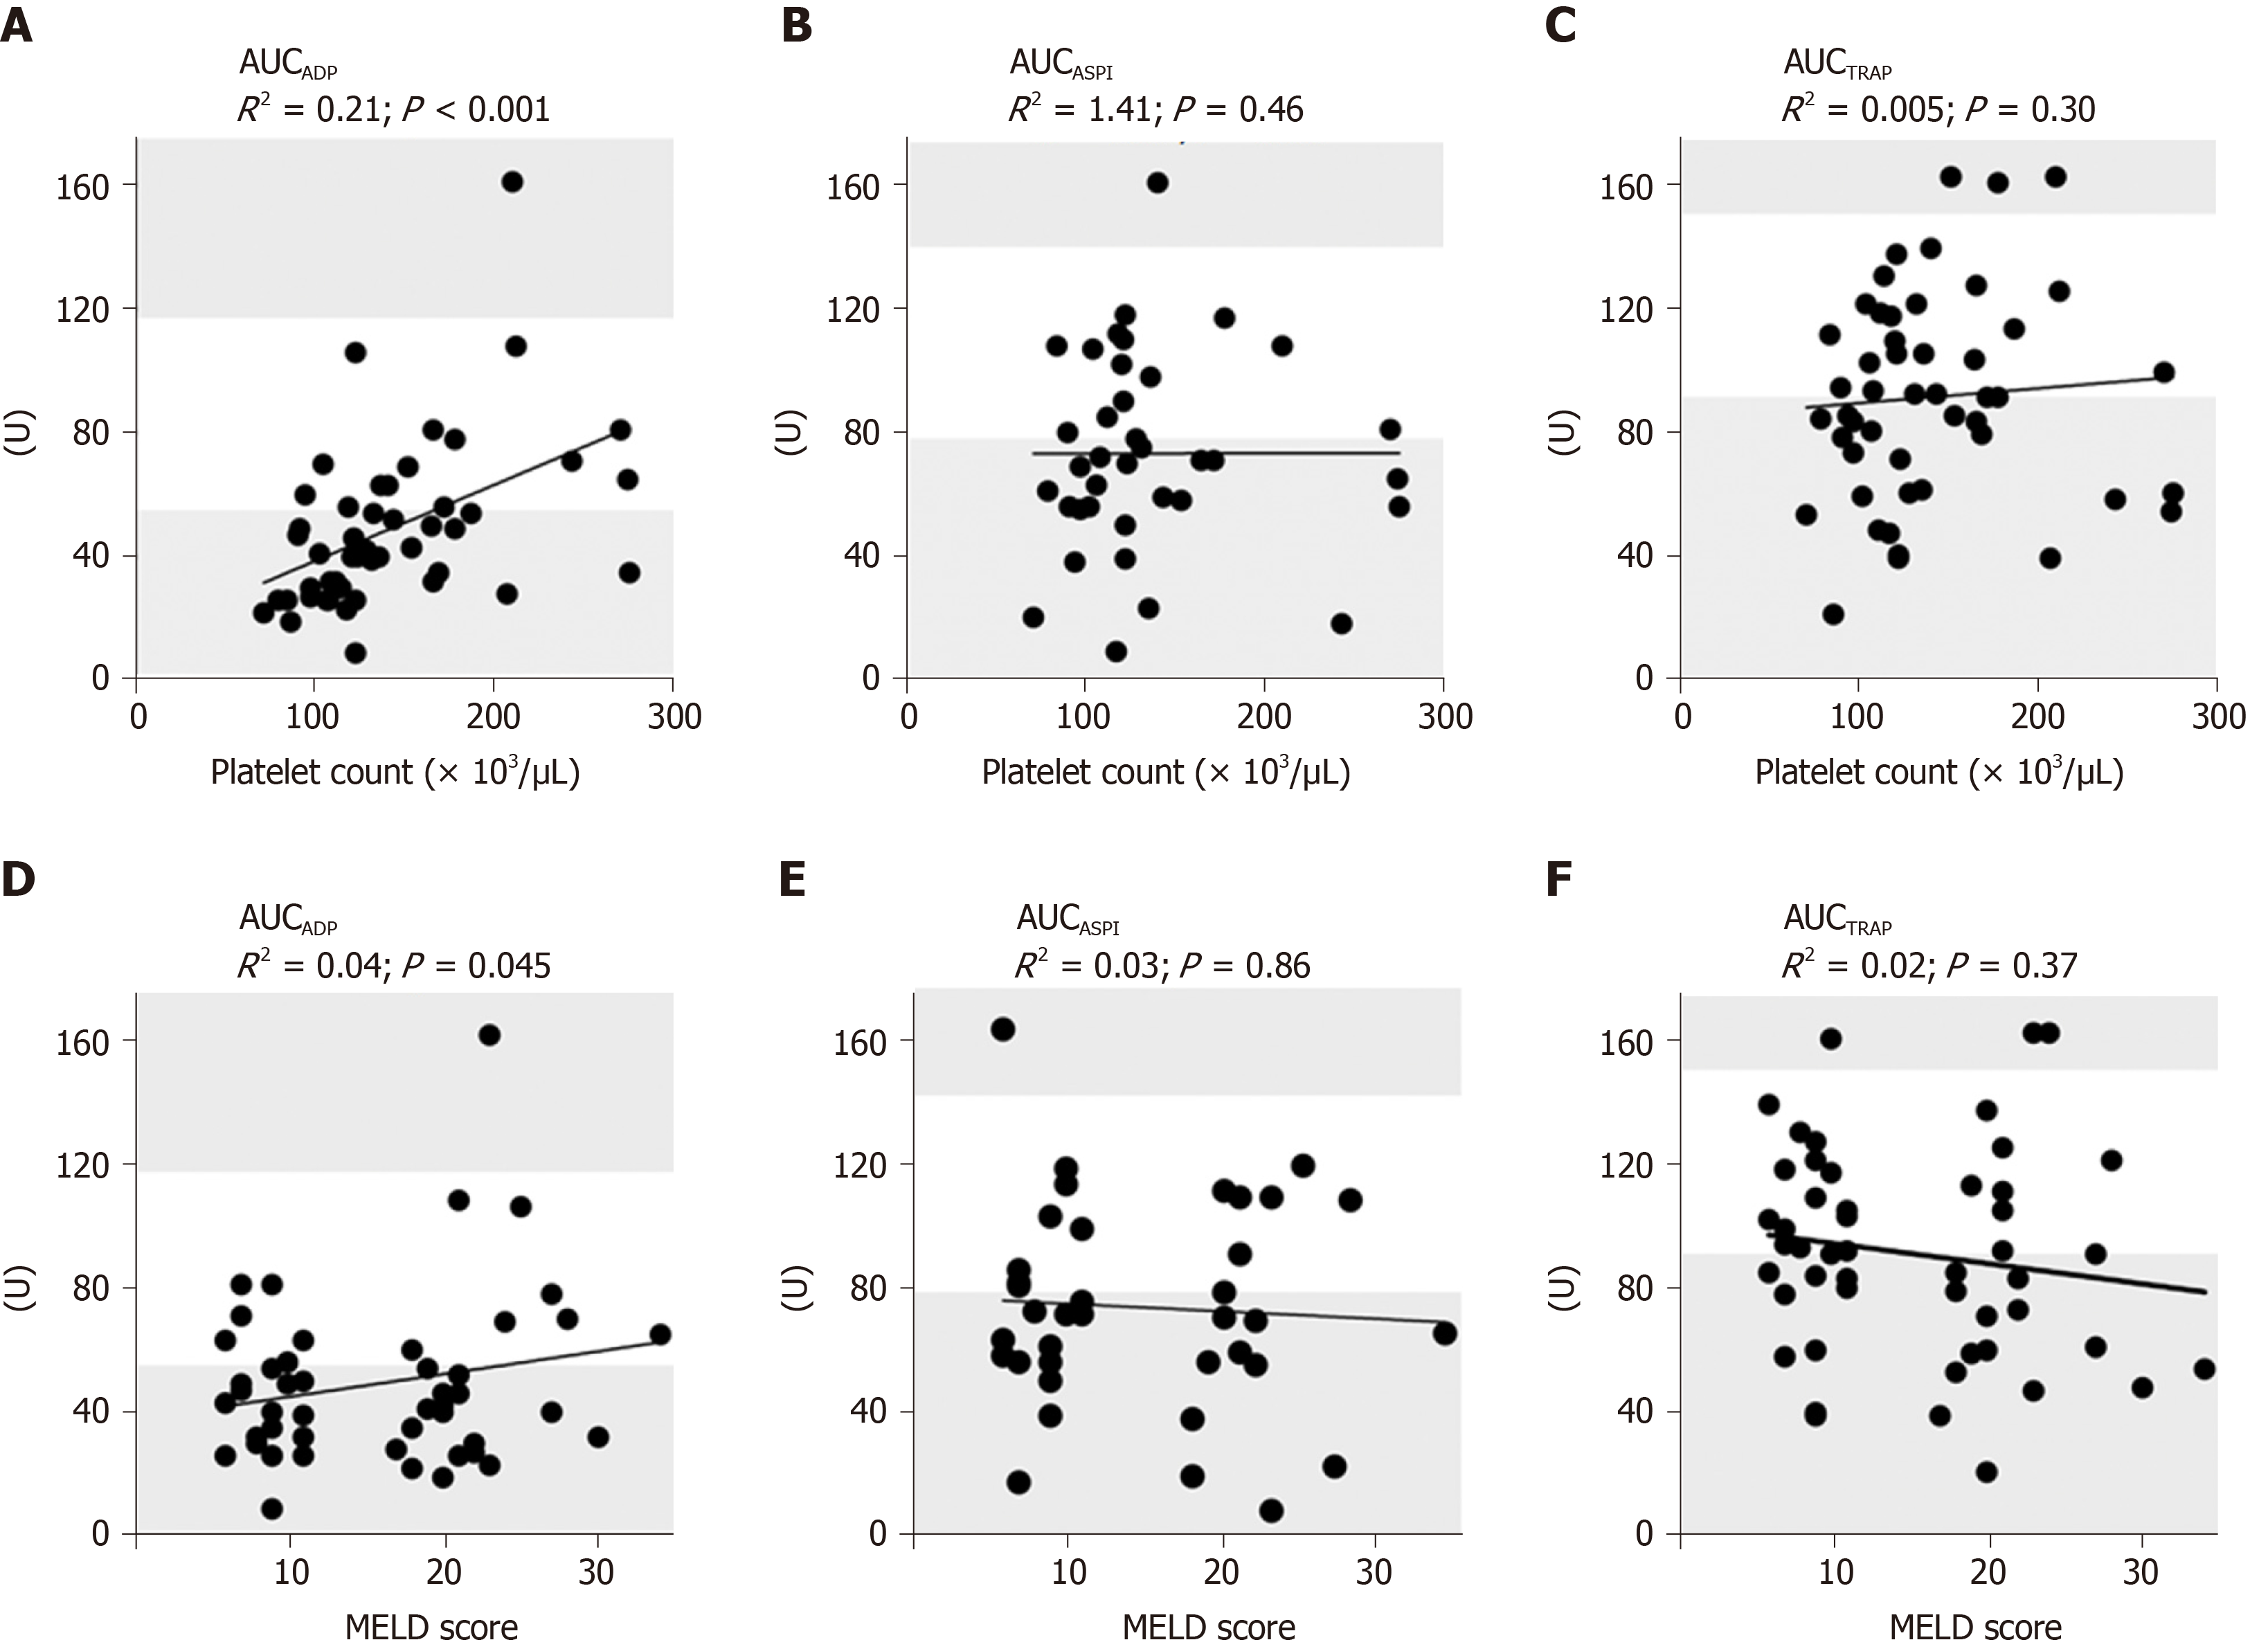
Figure 3 Spearman rank correlation analysis and linear regression line fitting of area under the curve of impedance aggregometric assays.
A-C: Scatterplots illustrating the relationship between platelet count and area under the curve (AUC, U) of impedance aggregometric assay: ADP-test (A), ASPI-test (B), TRAP-test (C); D-F: Scatterplots illustrating the relationship between model for end-stage liver disease score and AUC (U) of impedance aggregometric assay: ADP-test (D), ASPI-test (E), TRAP-test (F). Spearman rank correlation coefficients (R2) between model for end-stage liver disease score and AUC of impedance aggregometry with P values are given for each test. The upper and lower reference ranges of AUC are highlighted in the grey area. AUC: Area under the curve; ADP: Adenosine-5 diphosphate; ASPI: Arachidonic acid; TRAP: Thrombin receptor activator peptide 6; MELD: Model for end-stage liver disease.
- Citation: Adam EH, Möhlmann M, Herrmann E, Schneider S, Zacharowski K, Zeuzem S, Weber CF, Weiler N. Assessment of hemostatic profile in patients with mild to advanced liver cirrhosis. World J Gastroenterol 2020; 26(17): 2097-2110
- URL: https://www.wjgnet.com/1007-9327/full/v26/i17/2097.htm
- DOI: https://dx.doi.org/10.3748/wjg.v26.i17.2097


