Copyright
©The Author(s) 2020.
World J Gastroenterol. May 7, 2020; 26(17): 2097-2110
Published online May 7, 2020. doi: 10.3748/wjg.v26.i17.2097
Published online May 7, 2020. doi: 10.3748/wjg.v26.i17.2097
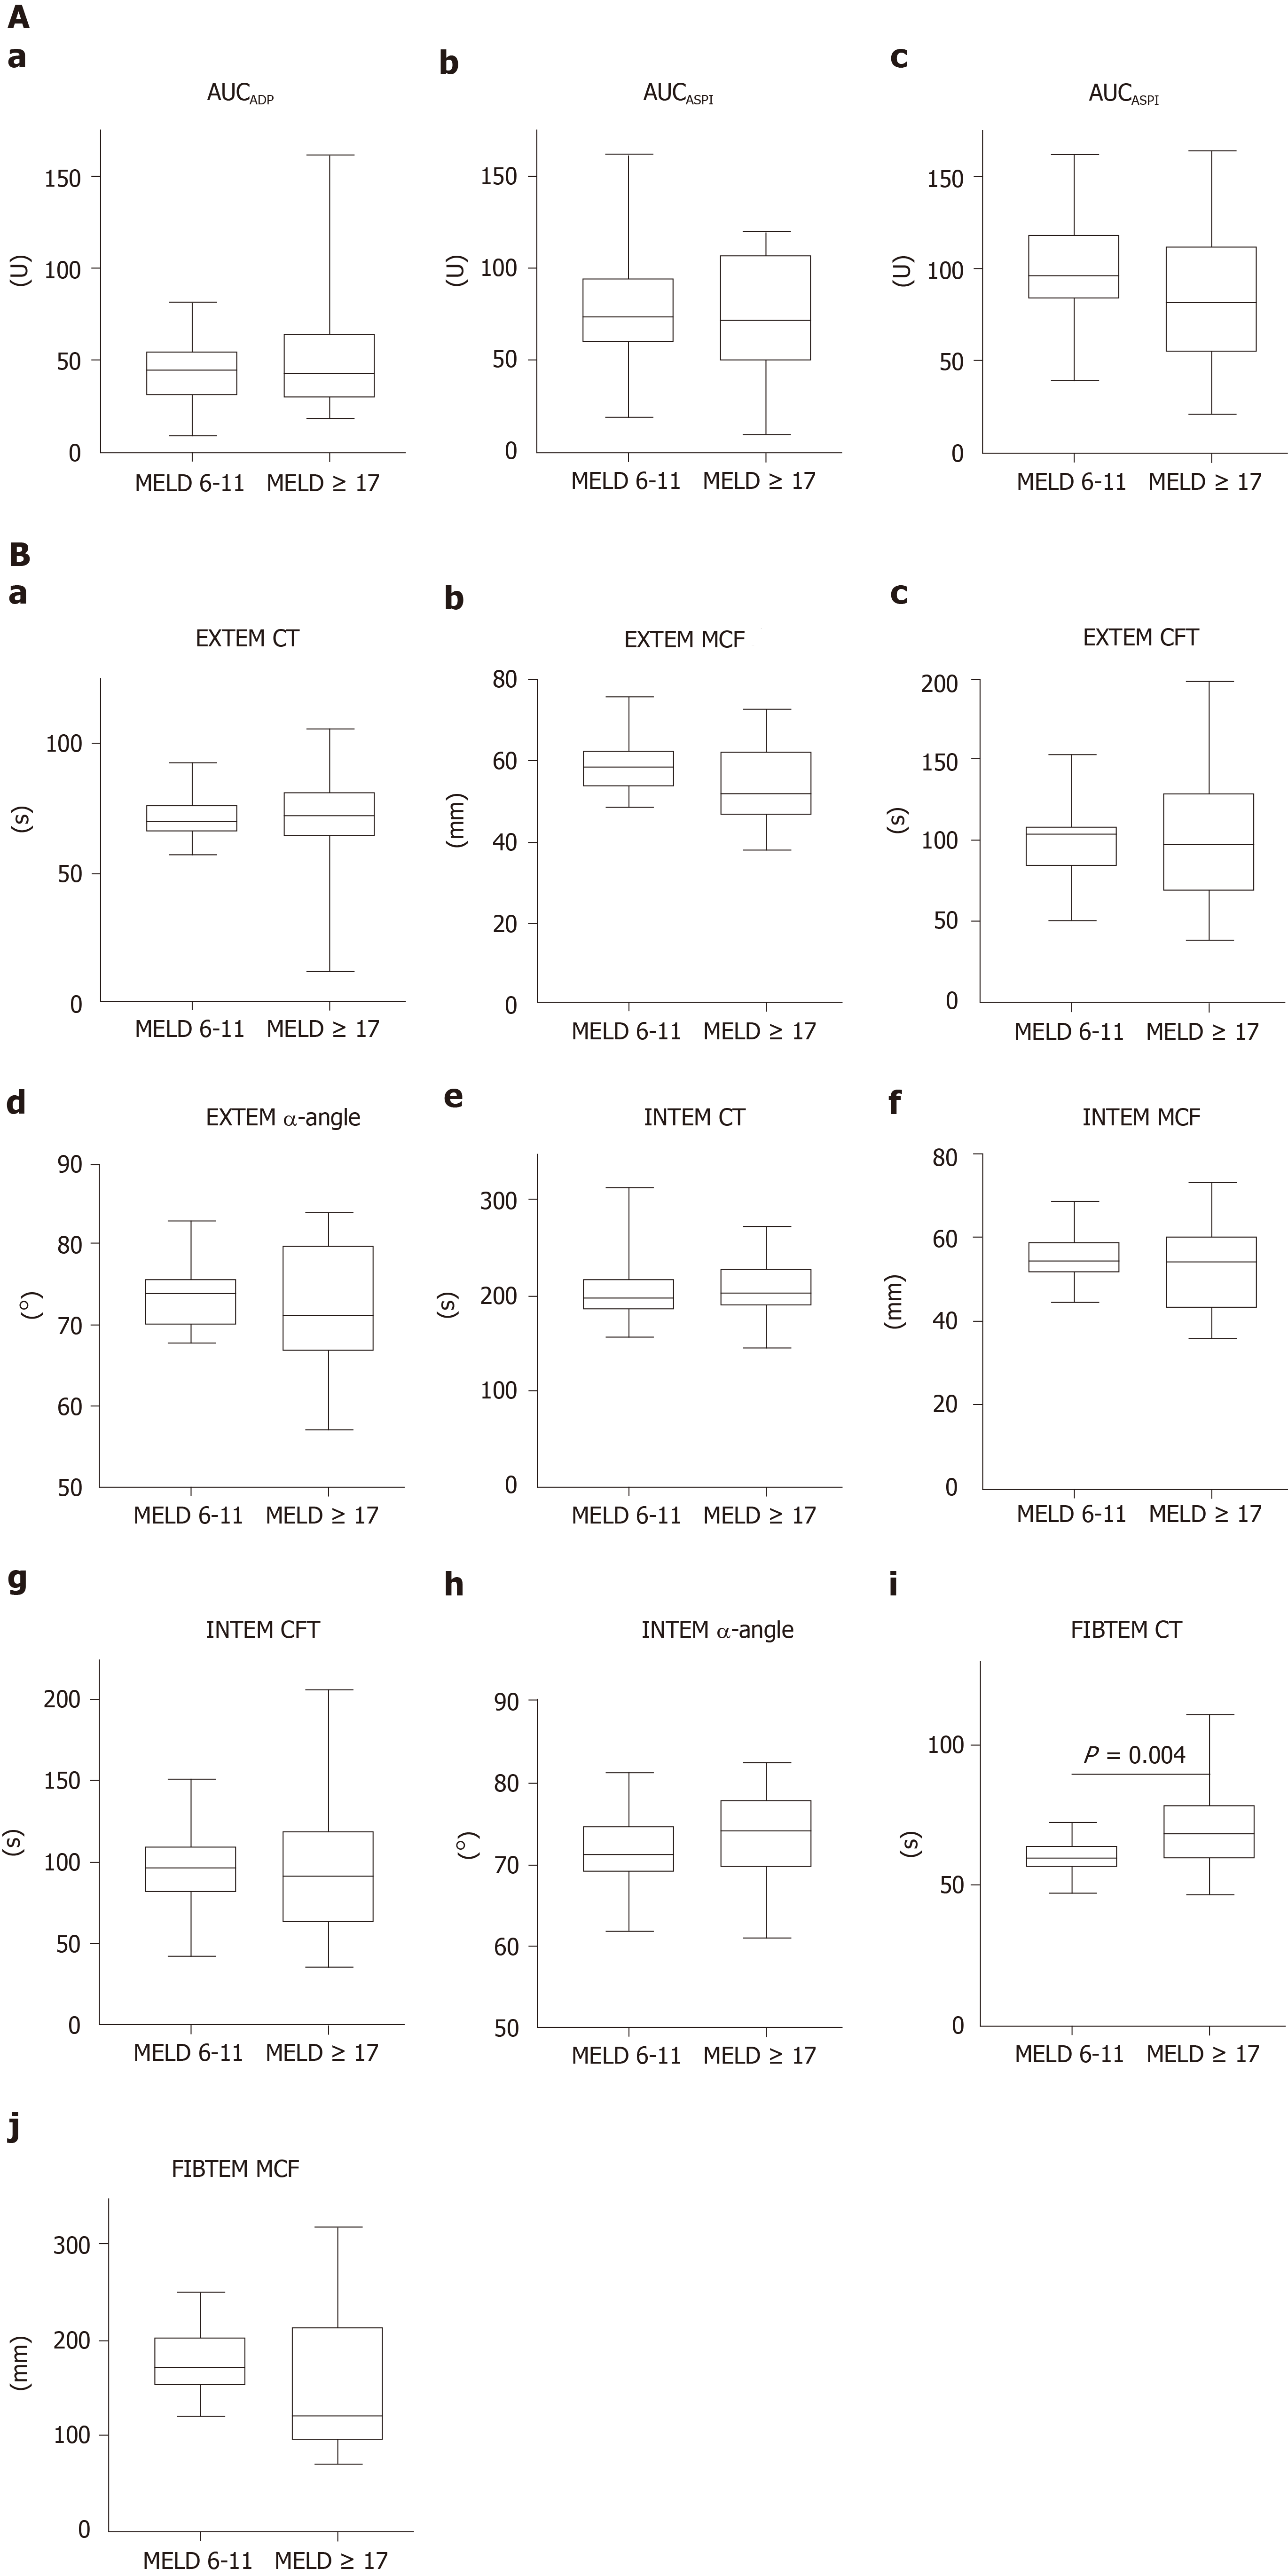
Figure 2 Impedance aggregometry and thrombelastometry in patients with mild and severe liver cirrhosis.
A: Box and whisker plots of impedance aggregometry: Results are presented for area under the curve (AUC) of ADP (a), AUCASPI (b) and AUCTRAP (c); B: Box and whisker plots of thrombelastometry: Presented are results of EXTEM clotting time (CT) (a), EXTEM clot formation time (b), EXTEM maximum clot firmness (MCF) (c), EXTEM α-angle (d), INTEM CT (e), INTEM clot formation time (f), INTEM MCF (g), INTEM α-angle (h), FIBTEM CT (i) and FIBTEM MCF (j). The lower and upper bars represent the minimum and maximum, respectively. The lower and upper ends of the box represent the 25th and 75th percentiles, respectively; the line in the box represents the median. Data comparisons were made using Mann-Whitney U-test. ADP: Adenosine-5 diphosphate; ASPI: Arachidonic acid; TRAP: Thrombin receptor activator peptide 6; MELD: Model for end-stage liver disease; CT: Clotting time; CFT: Clot formation time; MCF: Maximum clot firmness.
- Citation: Adam EH, Möhlmann M, Herrmann E, Schneider S, Zacharowski K, Zeuzem S, Weber CF, Weiler N. Assessment of hemostatic profile in patients with mild to advanced liver cirrhosis. World J Gastroenterol 2020; 26(17): 2097-2110
- URL: https://www.wjgnet.com/1007-9327/full/v26/i17/2097.htm
- DOI: https://dx.doi.org/10.3748/wjg.v26.i17.2097


