Copyright
©The Author(s) 2019.
World J Gastroenterol. Dec 21, 2019; 25(47): 6823-6834
Published online Dec 21, 2019. doi: 10.3748/wjg.v25.i47.6823
Published online Dec 21, 2019. doi: 10.3748/wjg.v25.i47.6823
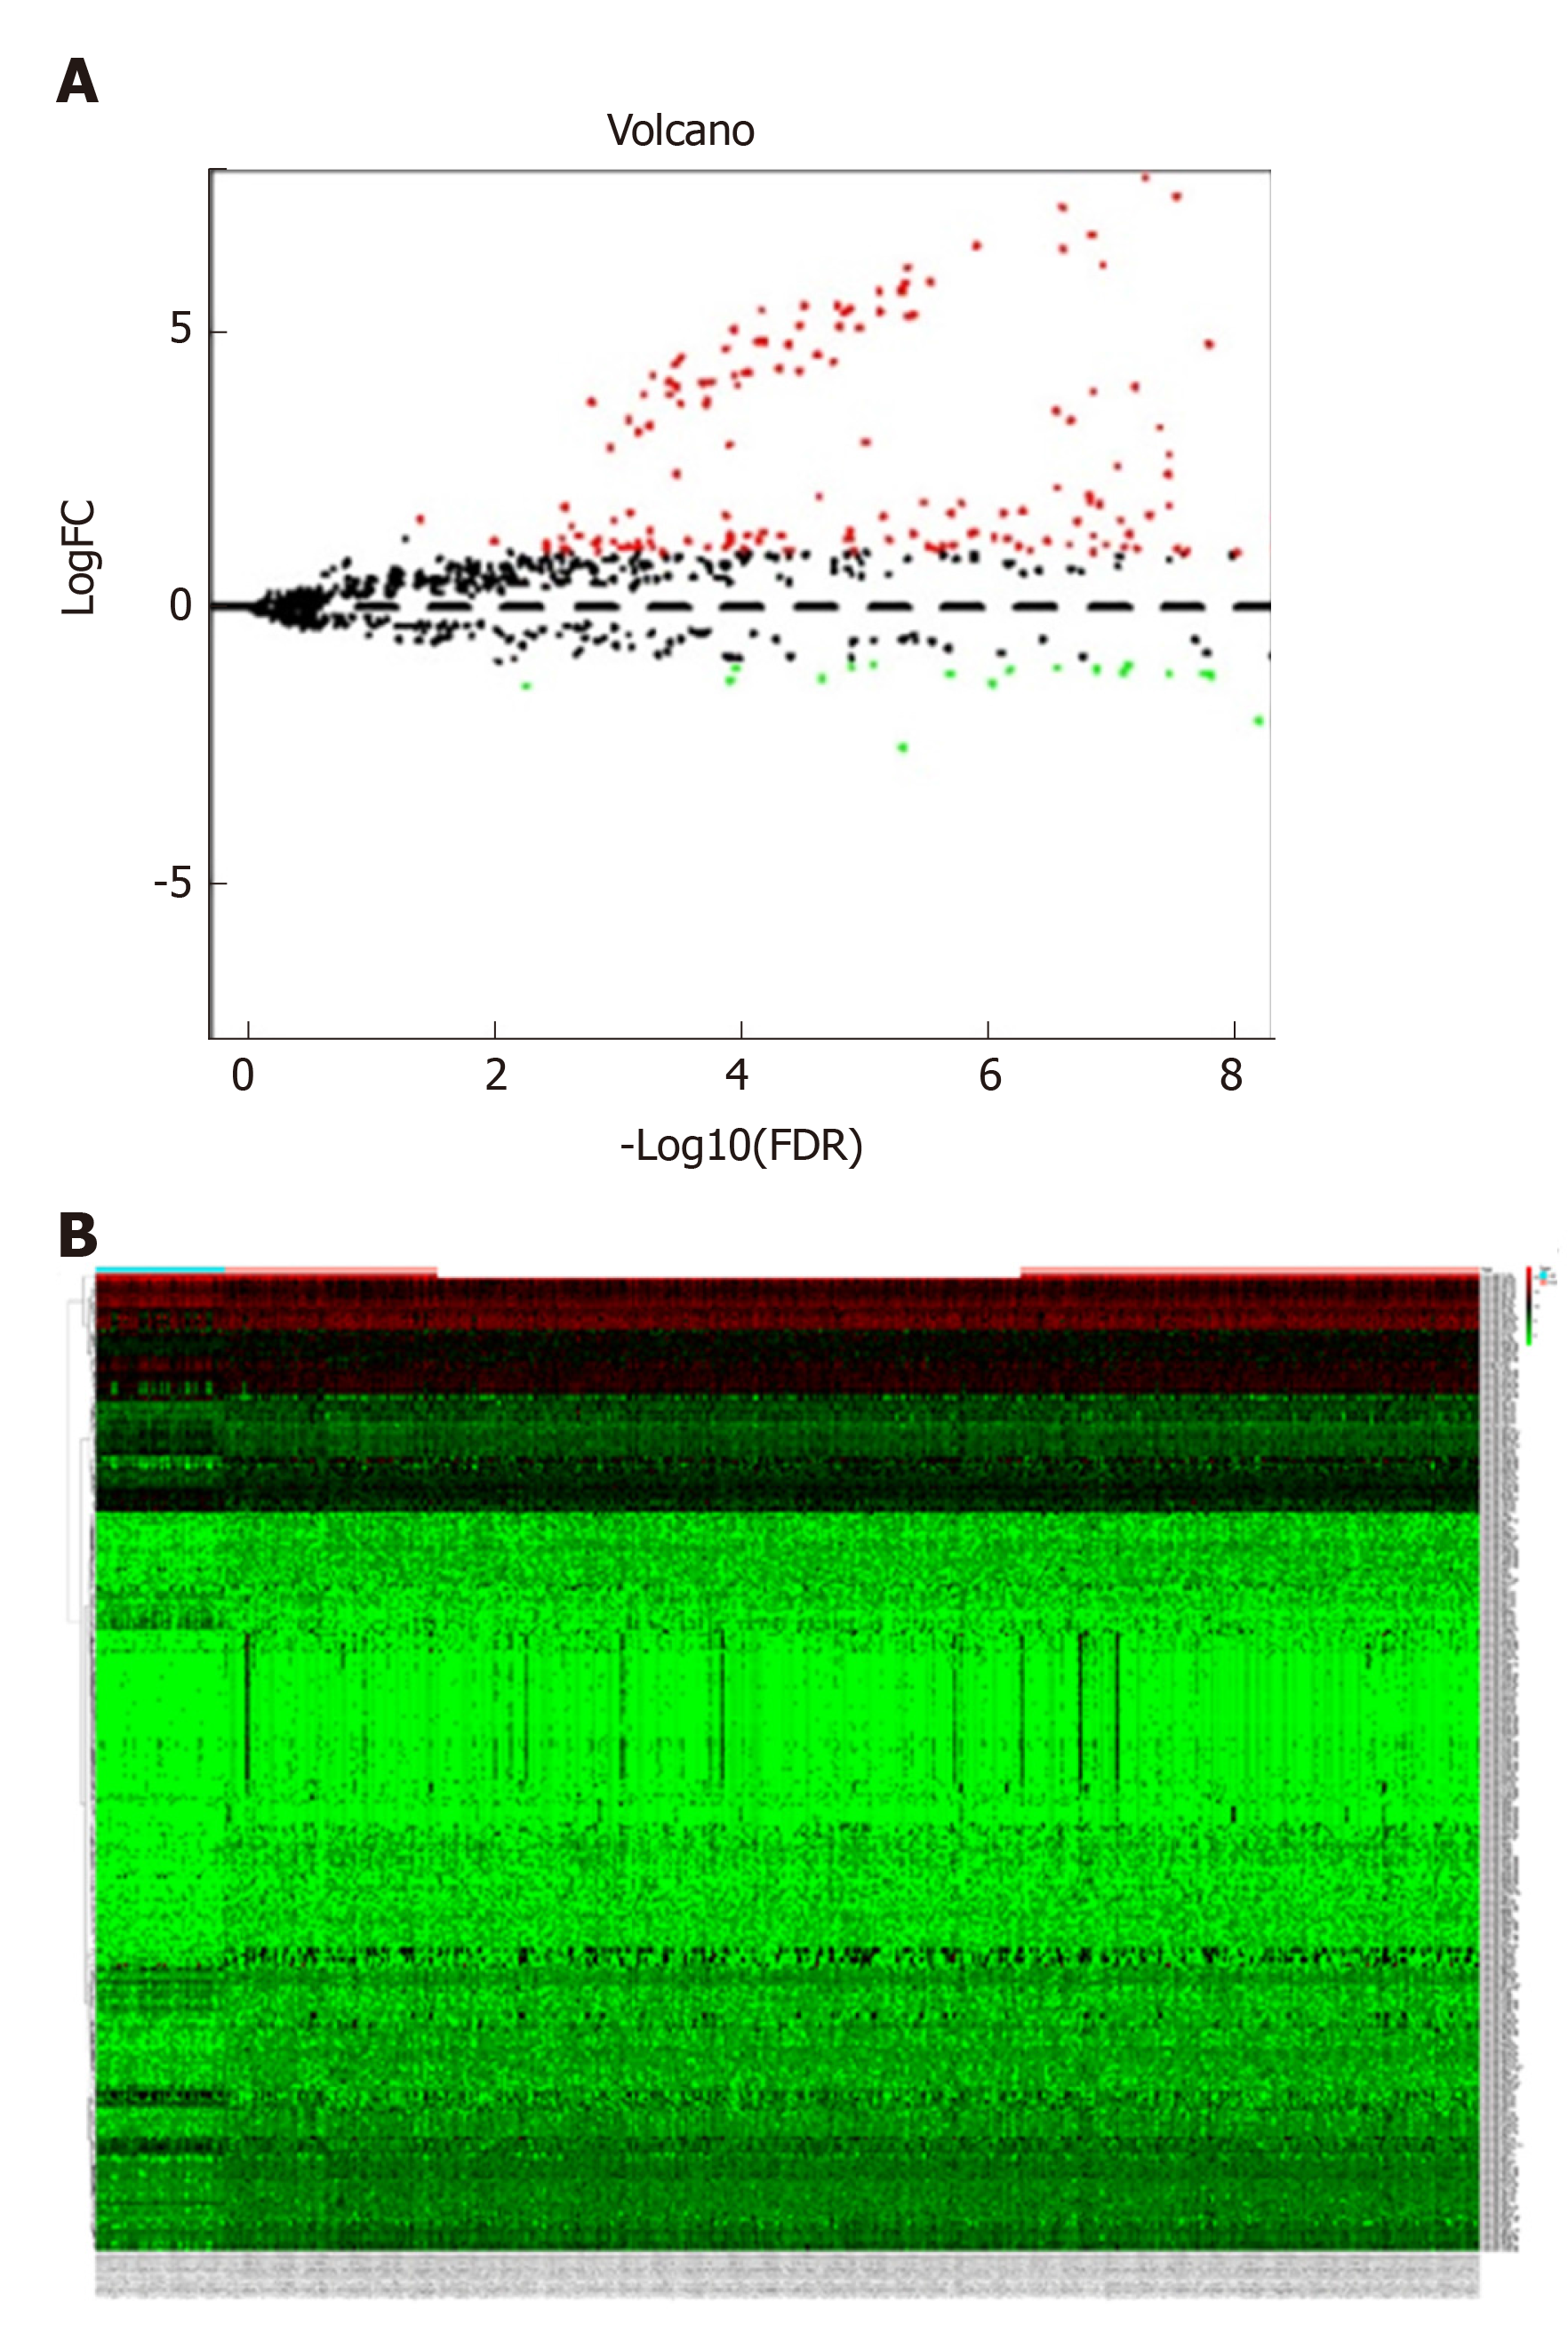
Figure 1 Differentially expressed miRNAs between gastric adenocarcinoma sample and normal sample.
A: Volcano plot for differentially expressed miRNA (DEM) expression. Dark dots represent upregulated miRNAs, whereas lighter dots represent downregulated miRNAs; B: Hierarchical gene clustering analysis of DEMs represented by a heat map. Dark represents upregulated miRNAs, whereas lighter represents downregulated miRNAs.
- Citation: Zhou HY, Wu CQ, Bi EX. MiR-96-5p inhibition induces cell apoptosis in gastric adenocarcinoma. World J Gastroenterol 2019; 25(47): 6823-6834
- URL: https://www.wjgnet.com/1007-9327/full/v25/i47/6823.htm
- DOI: https://dx.doi.org/10.3748/wjg.v25.i47.6823


