Copyright
©The Author(s) 2019.
World J Gastroenterol. Nov 21, 2019; 25(43): 6416-6429
Published online Nov 21, 2019. doi: 10.3748/wjg.v25.i43.6416
Published online Nov 21, 2019. doi: 10.3748/wjg.v25.i43.6416
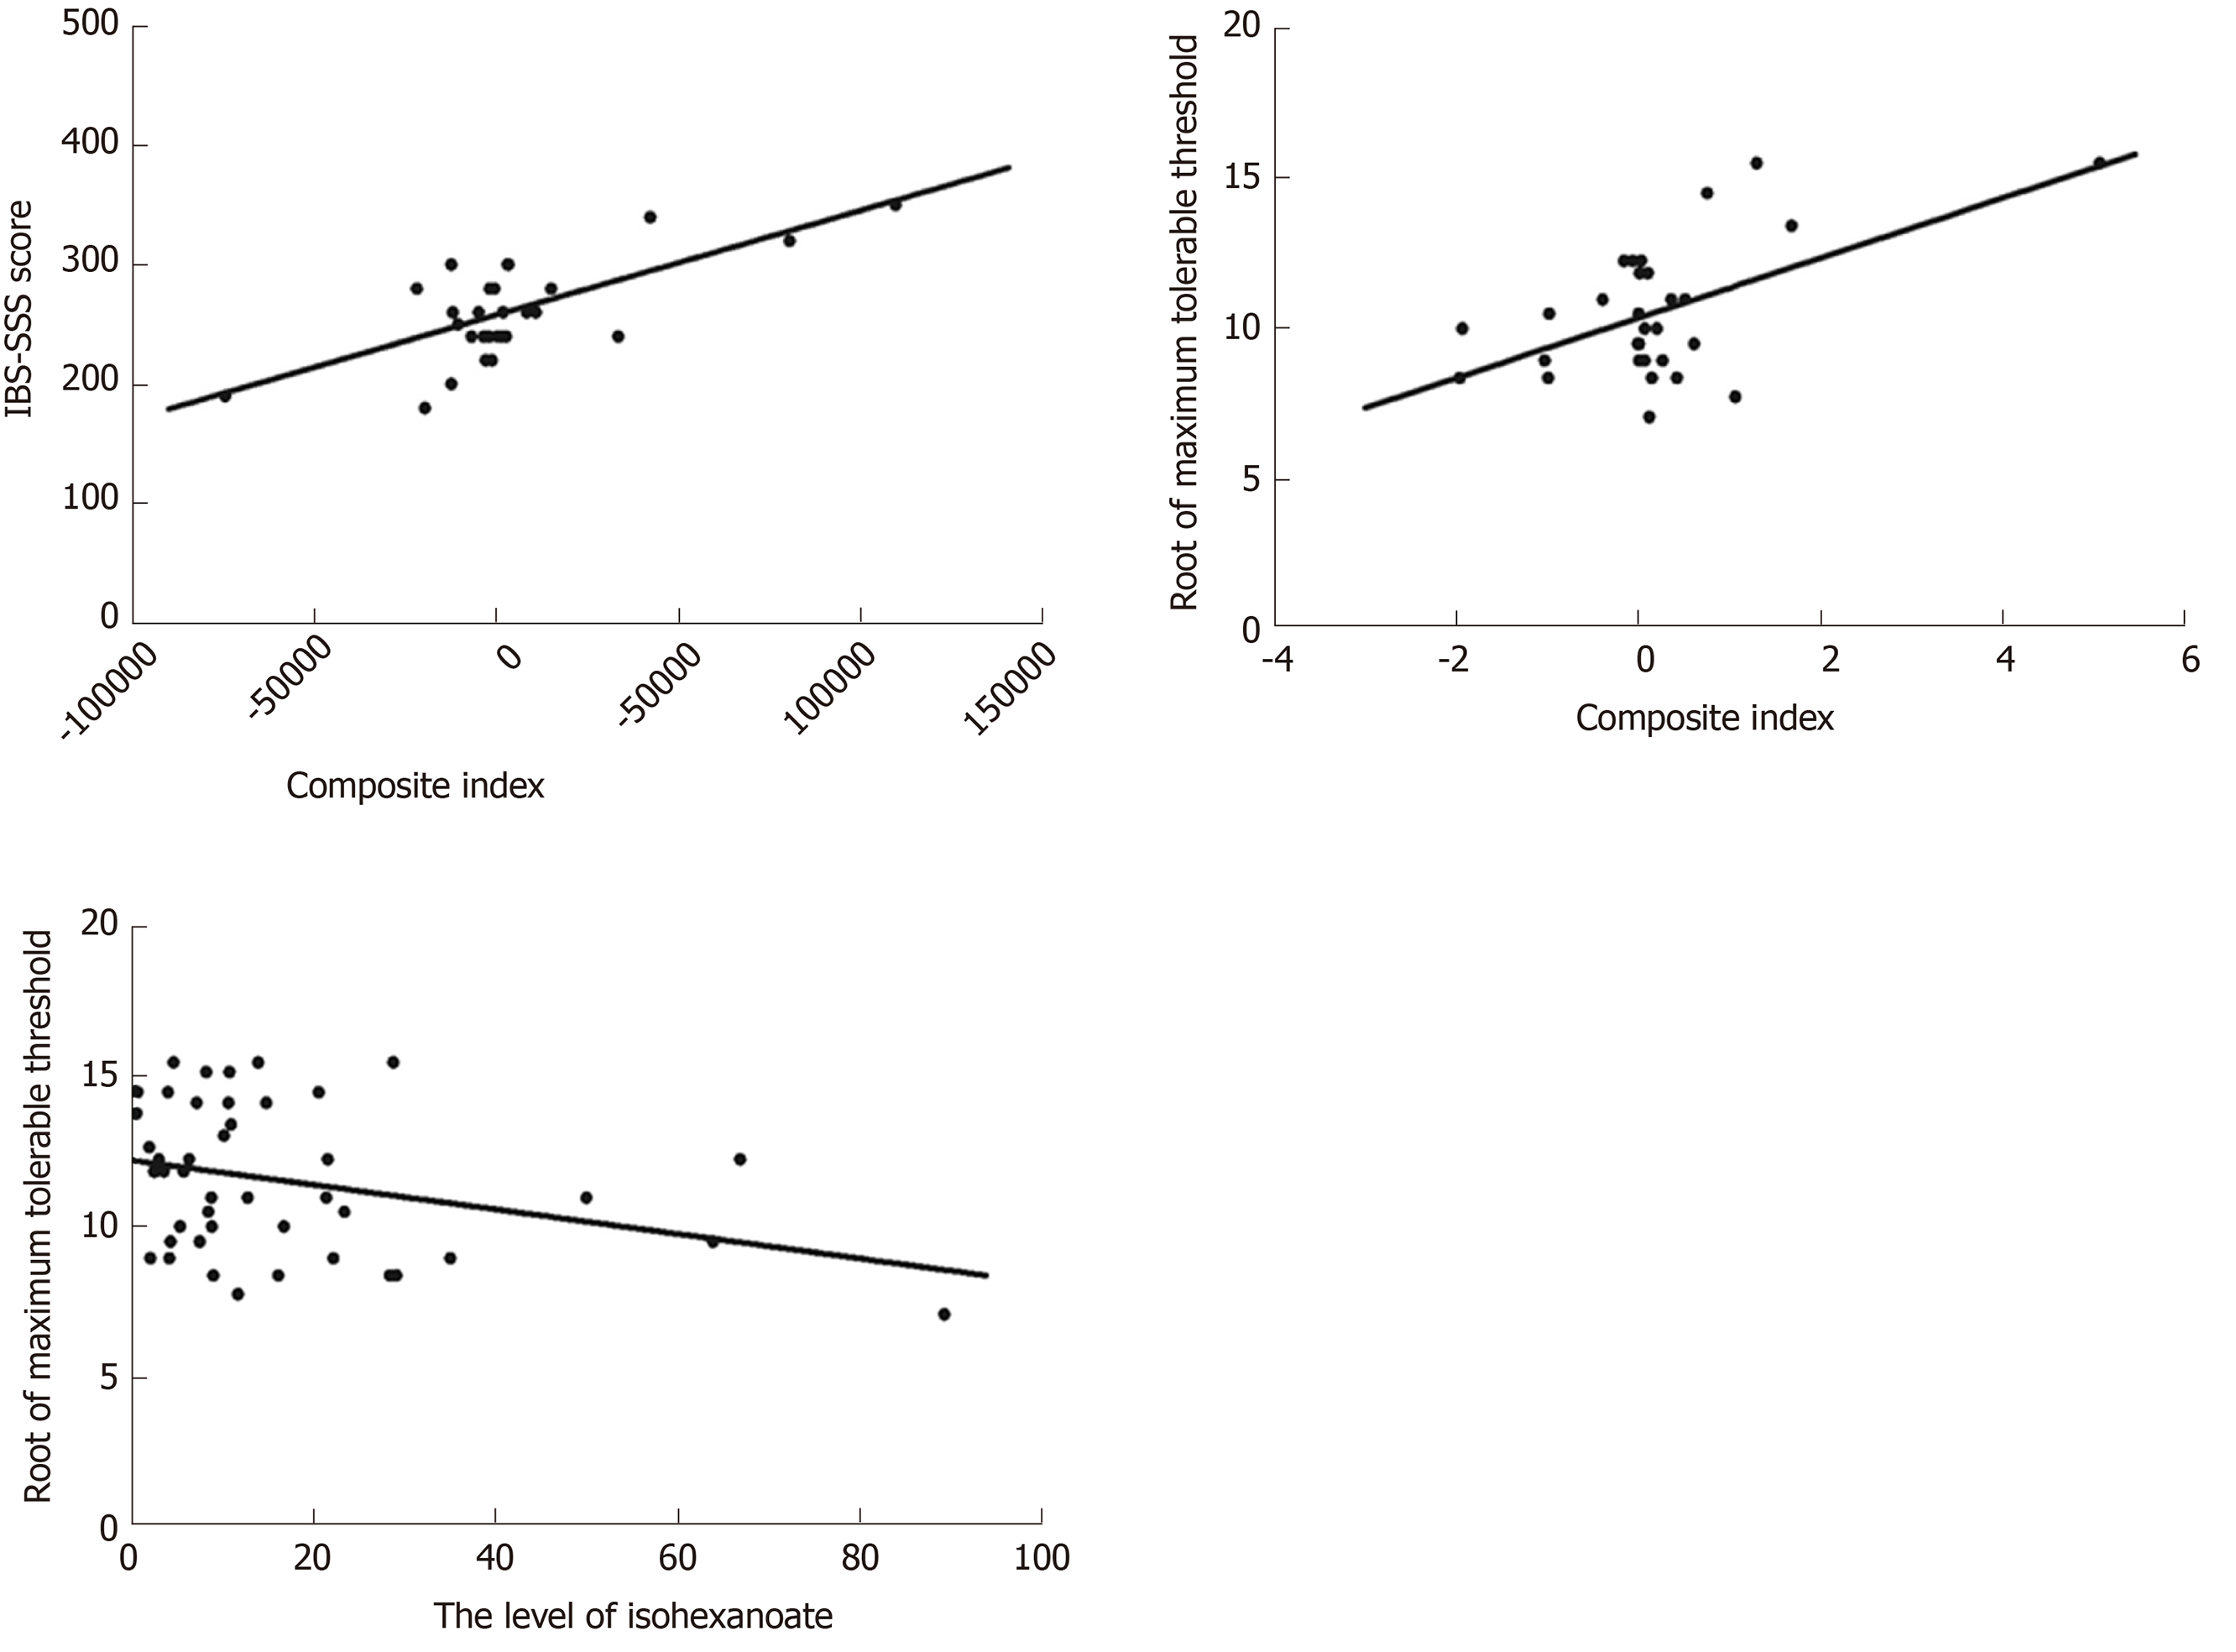
Figure 2 Correlation of fecal microbial metabolites with irritable bowel syndrome symptom severity scale score or maximum tolerable threshold.
A: Correlation of fecal microbial metabolites with irritable bowel syndrome symptom severity scale score in irritable bowel syndrome with predominant diarrhea (IBS-D) patients (R2Adjusted = 0.693, P < 0.001). The composite index was the sum of score based on linear combination of metabolites using the coefficients listed in Table 4. B: Correlation of metabolites with maximum tolerable threshold in IBS-D patients (R2Adjusted = 0.255, P = 0.007); The composite index was the sum of scores based on linear combination of isovalerate and valerate using the coefficients listed in Table 6. C: Correlation of metabolites with maximum tolerable threshold in all subjects (R2Adjusted = 0.079, P = 0.034).
- Citation: Zhang WX, Zhang Y, Qin G, Li KM, Wei W, Li SY, Yao SK. Altered profiles of fecal metabolites correlate with visceral hypersensitivity and may contribute to symptom severity of diarrhea-predominant irritable bowel syndrome. World J Gastroenterol 2019; 25(43): 6416-6429
- URL: https://www.wjgnet.com/1007-9327/full/v25/i43/6416.htm
- DOI: https://dx.doi.org/10.3748/wjg.v25.i43.6416


