Copyright
©The Author(s) 2019.
World J Gastroenterol. Oct 21, 2019; 25(39): 5953-5960
Published online Oct 21, 2019. doi: 10.3748/wjg.v25.i39.5953
Published online Oct 21, 2019. doi: 10.3748/wjg.v25.i39.5953
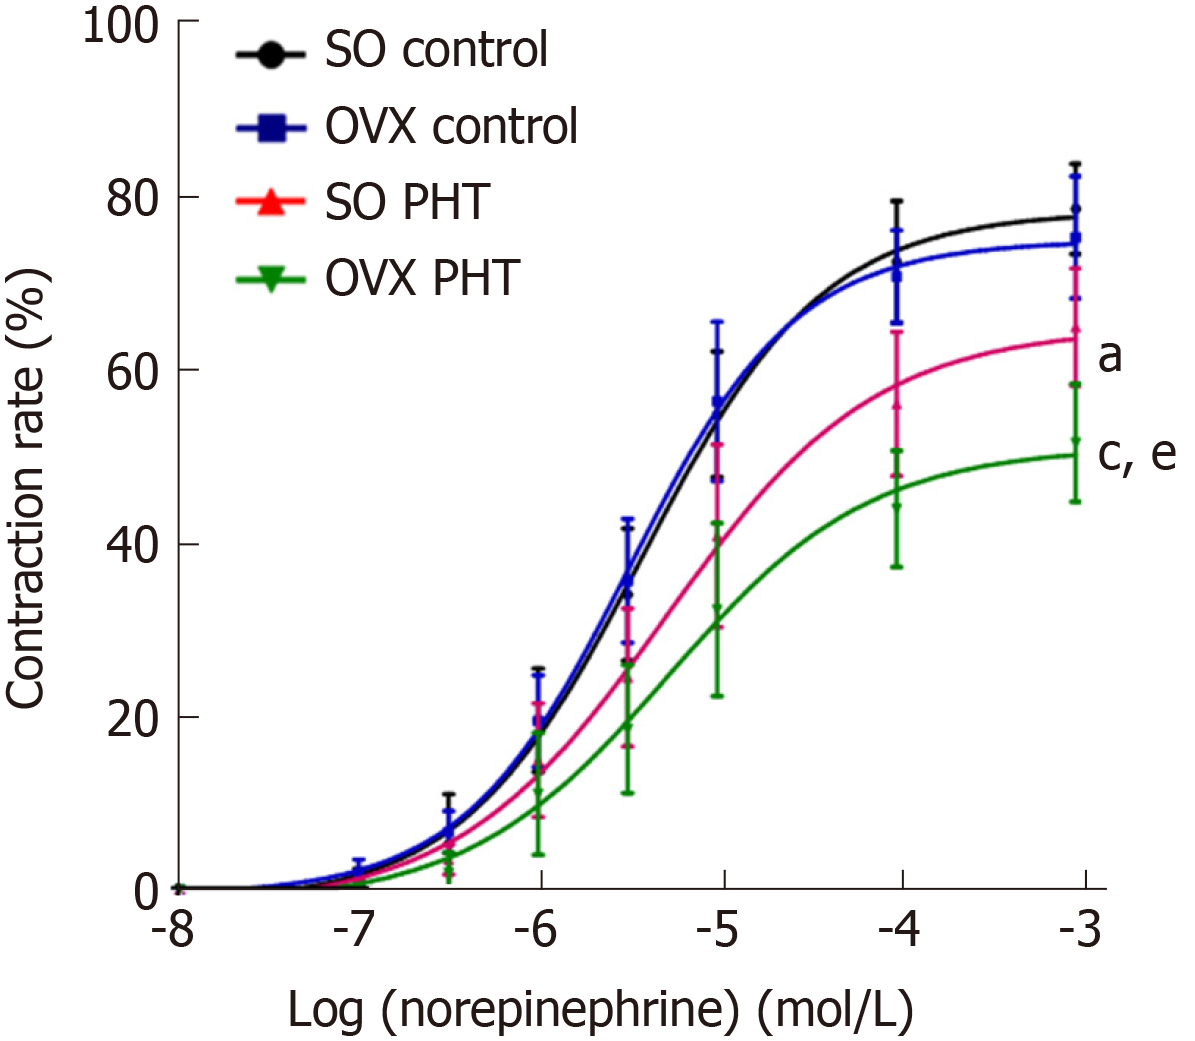
Figure 4 Concentration response curves of mesenteric arterioles to NE from the four female groups.
In non-PHT female rats, concentration response curves coincided with each other in SO control and OVX control rats. In the PHT rats, the concentration response curves were lowered and shifted to the right compared to SO control rats. However, the concentration response curve was lowered and shifted to the right in OVX PHT rats compared to SO PHT rats. aP < 0.05 vs SO control rats; cP < 0.05 vs OVX control rats; eP < 0.05 vs SO PHT rats. PHT: Portal hypertension; SO: Sham operation; OVX: Ovariectomized.
- Citation: Zhang B, Ji LH, Zhang CG, Zhao G, Wu ZY. Gender differences in vascular reactivity of mesenteric arterioles in portal hypertensive and non-portal hypertensive rats. World J Gastroenterol 2019; 25(39): 5953-5960
- URL: https://www.wjgnet.com/1007-9327/full/v25/i39/5953.htm
- DOI: https://dx.doi.org/10.3748/wjg.v25.i39.5953


