Copyright
©The Author(s) 2019.
World J Gastroenterol. Oct 7, 2019; 25(37): 5590-5603
Published online Oct 7, 2019. doi: 10.3748/wjg.v25.i37.5590
Published online Oct 7, 2019. doi: 10.3748/wjg.v25.i37.5590
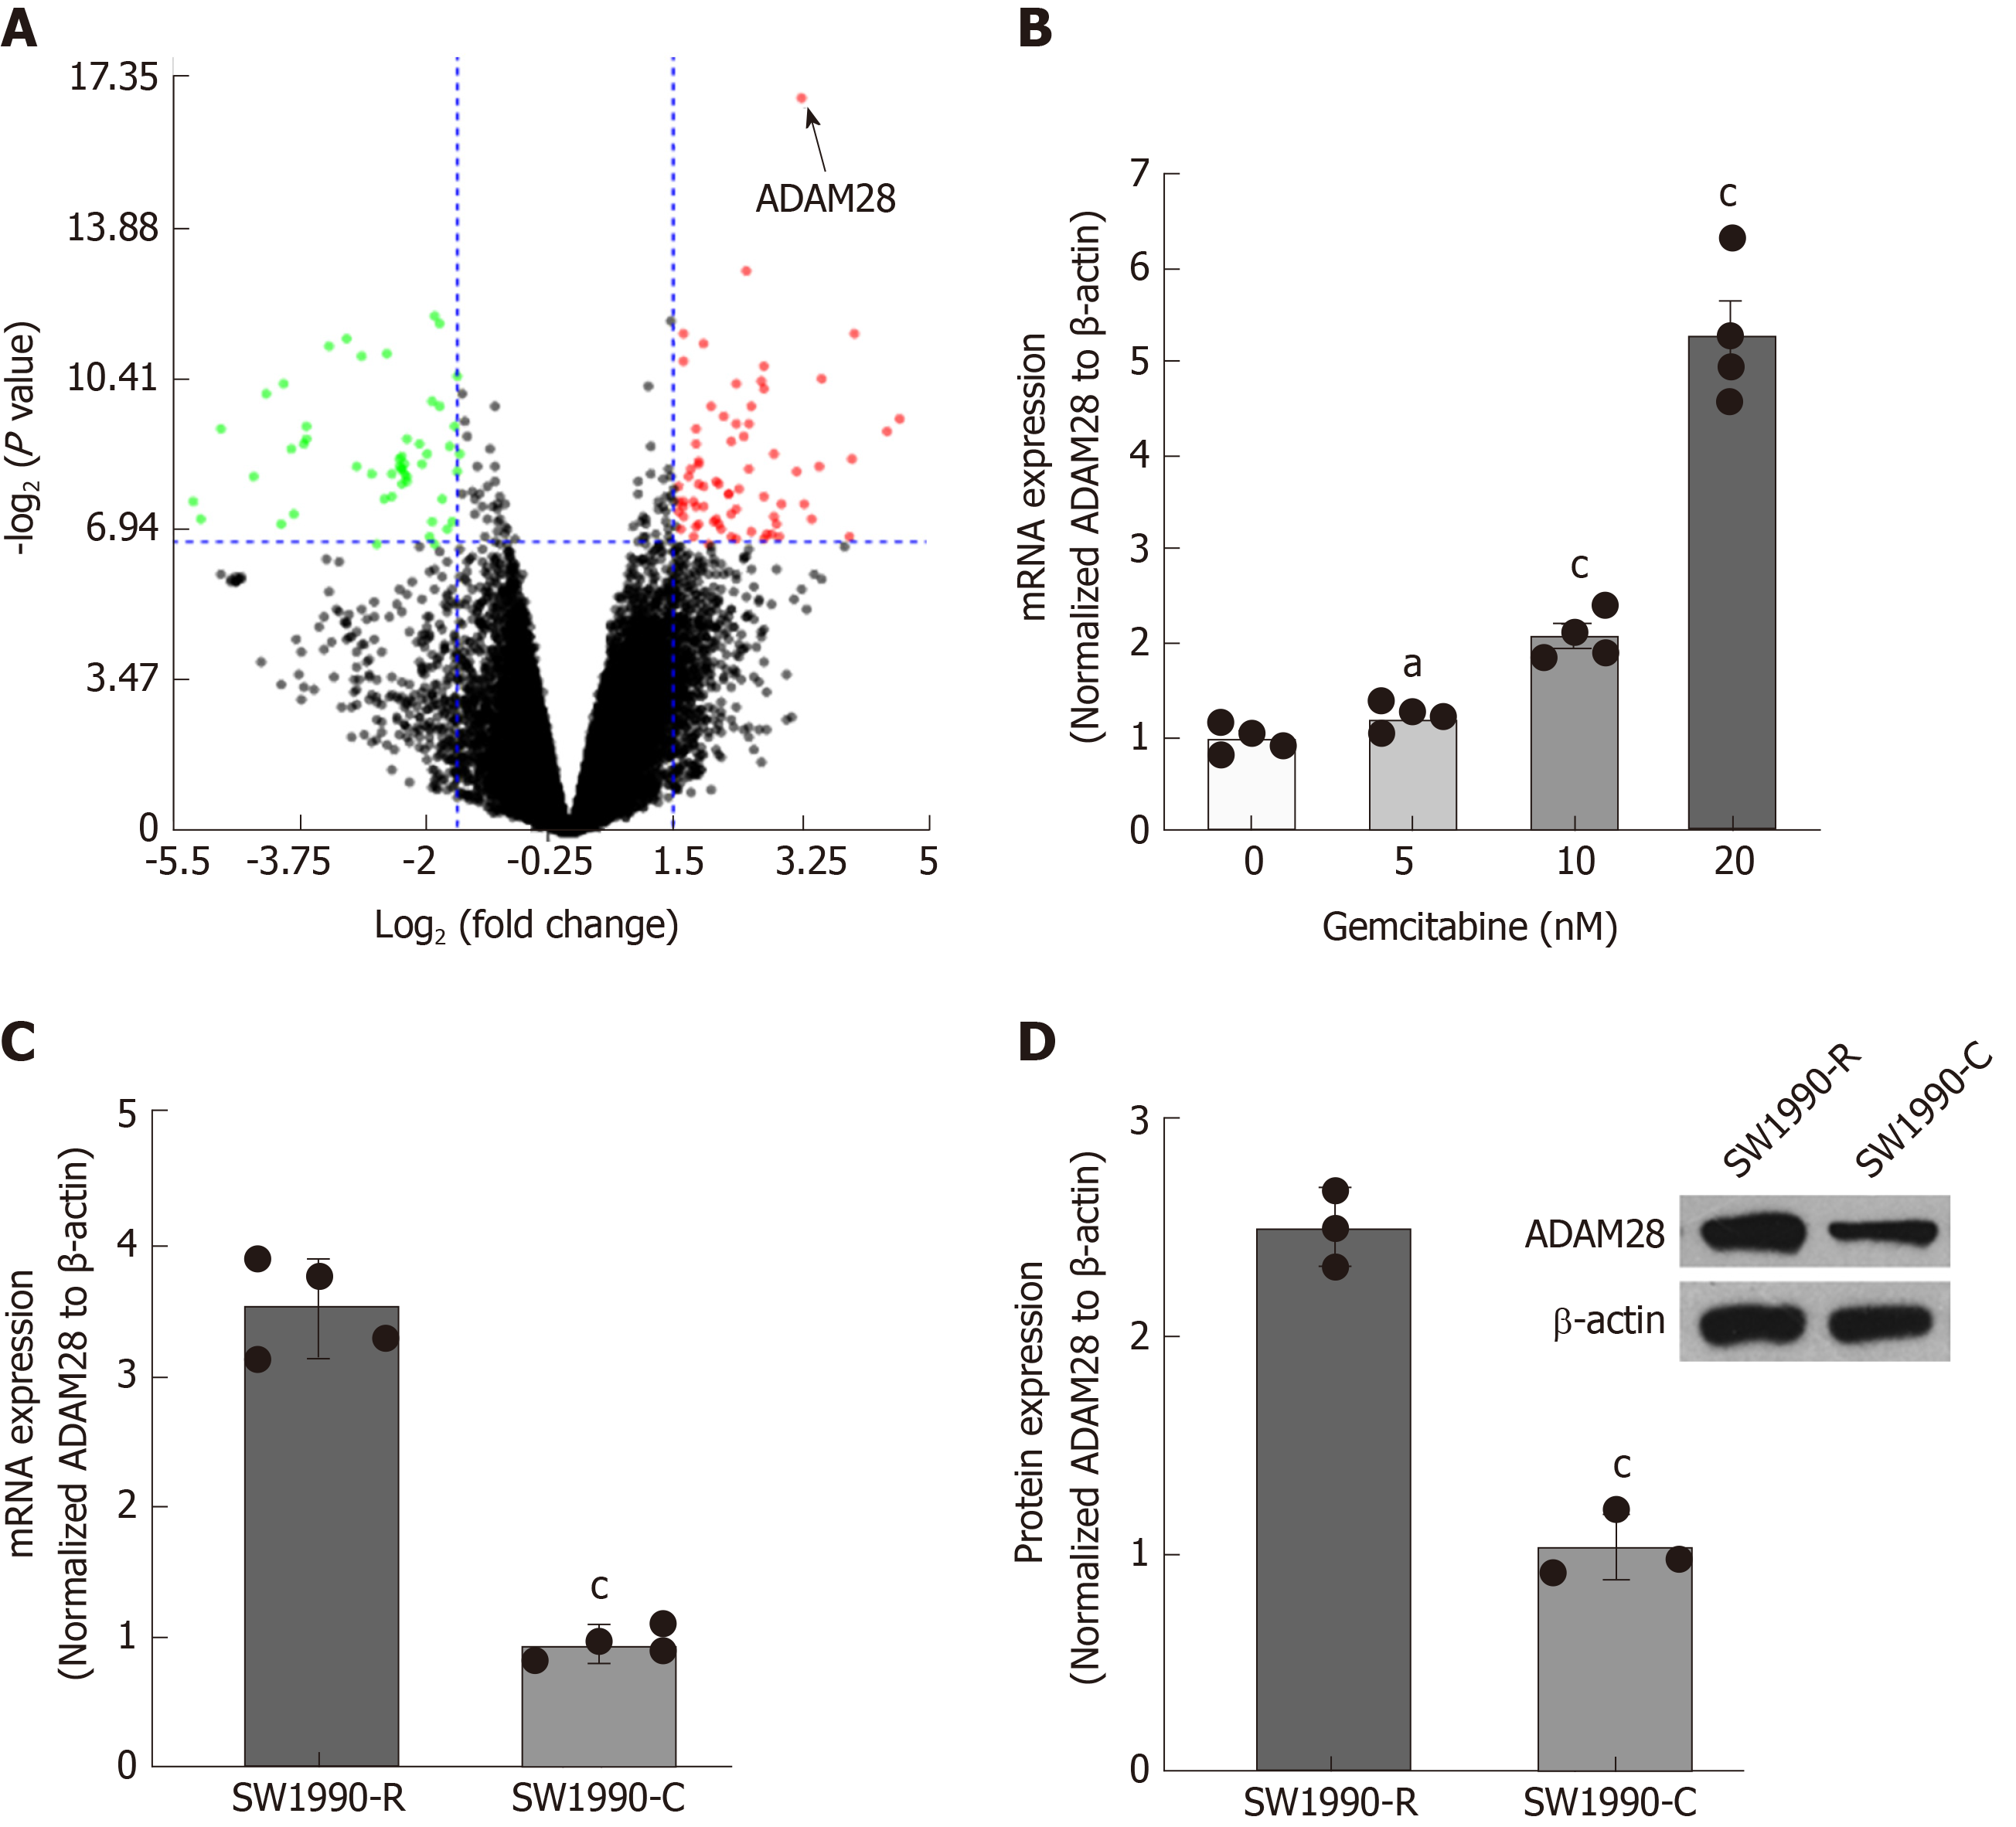
Figure 1 ADAM28 expression is elevated in gemcitabine-resistant pancreatic cancer cells.
A: GSE35141 was used to evaluate DEGs, and the significant genes are showed by a volcano plot with a threshold of fold change ≥ 1.5 and P-value < 0.01. The figure was prepared with NetworkAnalyst 3.0[28]; B: The mRNA levels of ADAM28 detected by RT-PCR in SW1990 cells treated with different doses of gemcitabine as indicated for 24 h. aP < 0.05, cP < 0.001 vs without gemcitabine treatment; C: The mRNA levels of ADAM28 examined by RT-PCR in gemcitabine-resistant SW1990 cells (SW1990-R) and sensitive parallel SW1990 (SW1990-C) cells. cP < 0.001 vs SW1990 sensitive cells (SW1990-C); D: The protein expression of ADAM28 was examined in gemcitabine-resistant and sensitive parallel SW1990 cells by Western blot, and Quantity One software was applied to quantify the protein levels. cP < 0.001 vs with SW1990 sensitive parallel cells (SW1990-C). DEGs: Differentially expressed genes; FC: Fold change; RT-PCR: Reverse transcription-polymerase chain reaction; SW1990-C: SW1990 sensitive parallel cells; SW1990-R: Gemcitabine-resistant SW1990 cells.
- Citation: Wei L, Wen JY, Chen J, Ma XK, Wu DH, Chen ZH, Huang JL. Oncogenic ADAM28 induces gemcitabine resistance and predicts a poor prognosis in pancreatic cancer. World J Gastroenterol 2019; 25(37): 5590-5603
- URL: https://www.wjgnet.com/1007-9327/full/v25/i37/5590.htm
- DOI: https://dx.doi.org/10.3748/wjg.v25.i37.5590


