Copyright
©The Author(s) 2019.
World J Gastroenterol. Aug 21, 2019; 25(31): 4383-4404
Published online Aug 21, 2019. doi: 10.3748/wjg.v25.i31.4383
Published online Aug 21, 2019. doi: 10.3748/wjg.v25.i31.4383
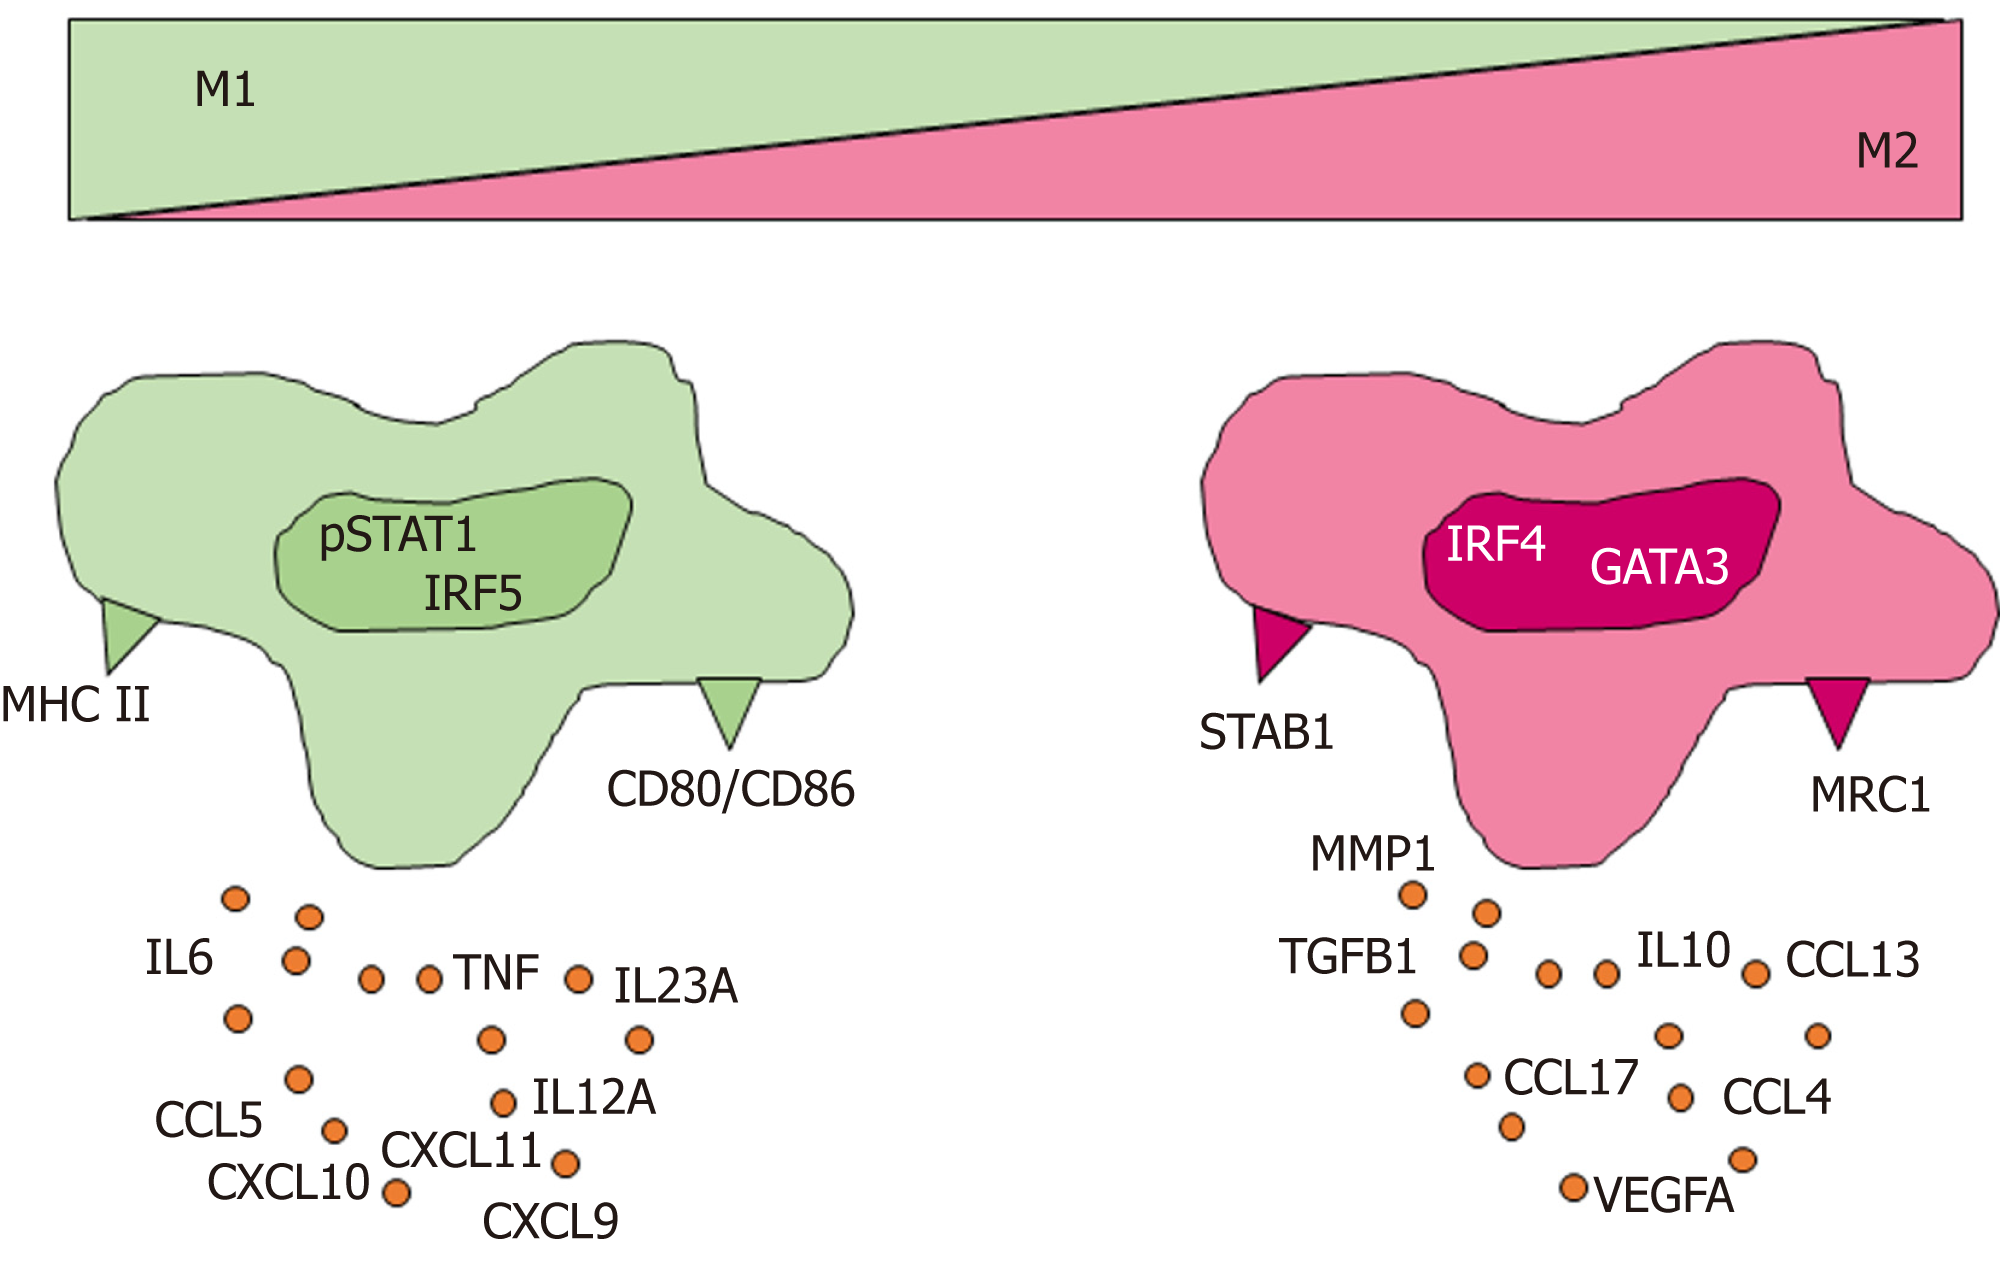
Figure 1 Phenotypic spectrum of macrophages.
The illustration portrays the heterogeneity of immune cell main categories in producing inflammatory mediators and growth factors based on their activation state. The image illustrates the spectrum model of macrophage polarization based on the M1-M2 paradigm. Macrophage polarization describes the type of macrophage activation at a given point in space and time[155]. The polarization can be viewed as a continuum, with M1 (pro-inflammatory) and M2 (anti-inflammatory) as the extremes. The M1 and M2 designations are based on in vitro stimulation with either interferon gamma (M1) or interleukin 4 (M2) without environmental influence[54]; in vivo, stimulation of macrophages with multiple cytokines may result in mixed phenotypes. The image shows examples of transcription factors, cell surface molecules and inflammatory mediators commonly associated with M1 and M2 polarization states. Similarly to macrophages, different activation states have been associated with other immune cell types such as neutrophils[57,58], B cells[56], and plasma cells[156]. CCL: C-C motif chemokine ligand; CD80: CD80 molecule; CD86: CD86 molecule; CXCL: C-X-C motif chemokine ligand; GATA3: GATA binding protein 3; IL: Interleukin; IRF: Interferon regulatory factor; MHC II: Major histocompatibility complex, type II; MMP1: Matrix metallopeptidase 1; MRC1; Mannose receptor C-type 1; pSTAT1: Phosphorylated signal transducer and activator of transcription 1; STAB1: Stabilin 1; TGFB1: Transforming growth factor beta 1; TNF: Tumor necrosis factor; VEGFA: Vascular endothelial growth factor A.
- Citation: Tuomisto AE, Mäkinen MJ, Väyrynen JP. Systemic inflammation in colorectal cancer: Underlying factors, effects, and prognostic significance. World J Gastroenterol 2019; 25(31): 4383-4404
- URL: https://www.wjgnet.com/1007-9327/full/v25/i31/4383.htm
- DOI: https://dx.doi.org/10.3748/wjg.v25.i31.4383


