Copyright
©The Author(s) 2019.
World J Gastroenterol. Jul 28, 2019; 25(28): 3775-3786
Published online Jul 28, 2019. doi: 10.3748/wjg.v25.i28.3775
Published online Jul 28, 2019. doi: 10.3748/wjg.v25.i28.3775
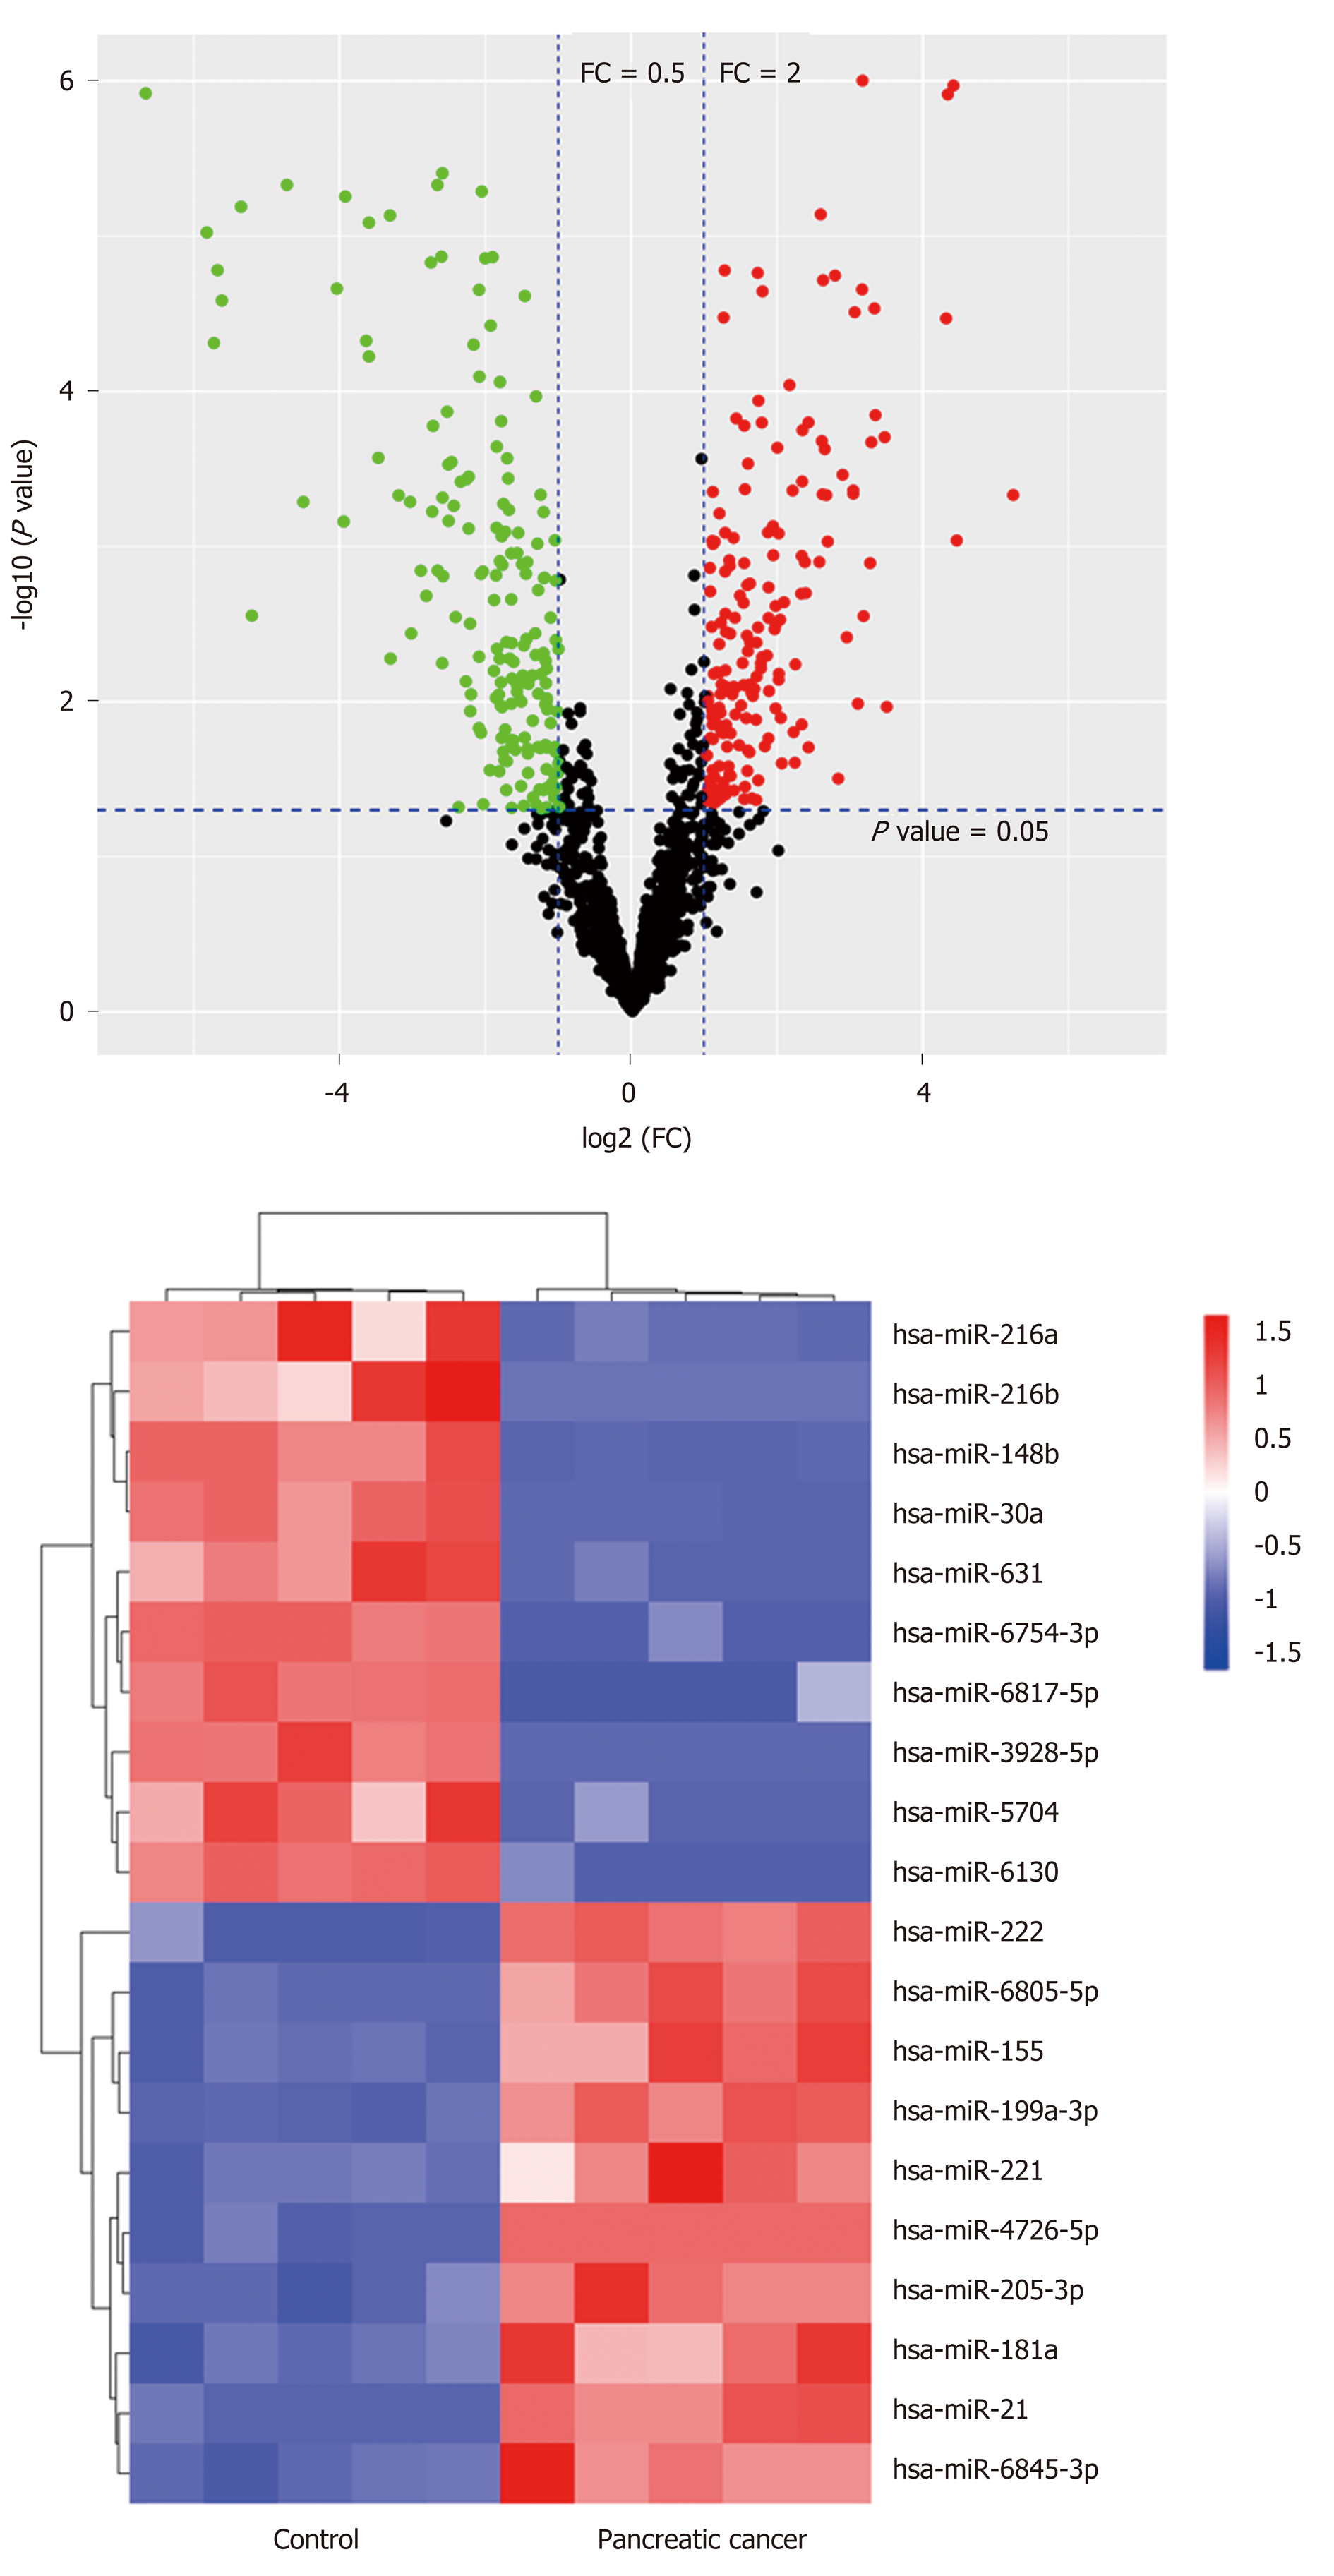
Figure 1 The miRNA expression profile in pancreatic cancer.
A: The volcano plot was constructed using P-values and fold change values; B: The clustered heatmap showed the top 20 differentially expressed miRNAs between the control and pancreatic cancer groups. Red indicates the up-regulated expression and green/blue indicates the down-regulated expression.
- Citation: Qin RF, Zhang J, Huo HR, Yuan ZJ, Xue JD. MiR-205 mediated APC regulation contributes to pancreatic cancer cell proliferation. World J Gastroenterol 2019; 25(28): 3775-3786
- URL: https://www.wjgnet.com/1007-9327/full/v25/i28/3775.htm
- DOI: https://dx.doi.org/10.3748/wjg.v25.i28.3775


