Copyright
©The Author(s) 2019.
World J Gastroenterol. Jul 14, 2019; 25(26): 3392-3407
Published online Jul 14, 2019. doi: 10.3748/wjg.v25.i26.3392
Published online Jul 14, 2019. doi: 10.3748/wjg.v25.i26.3392
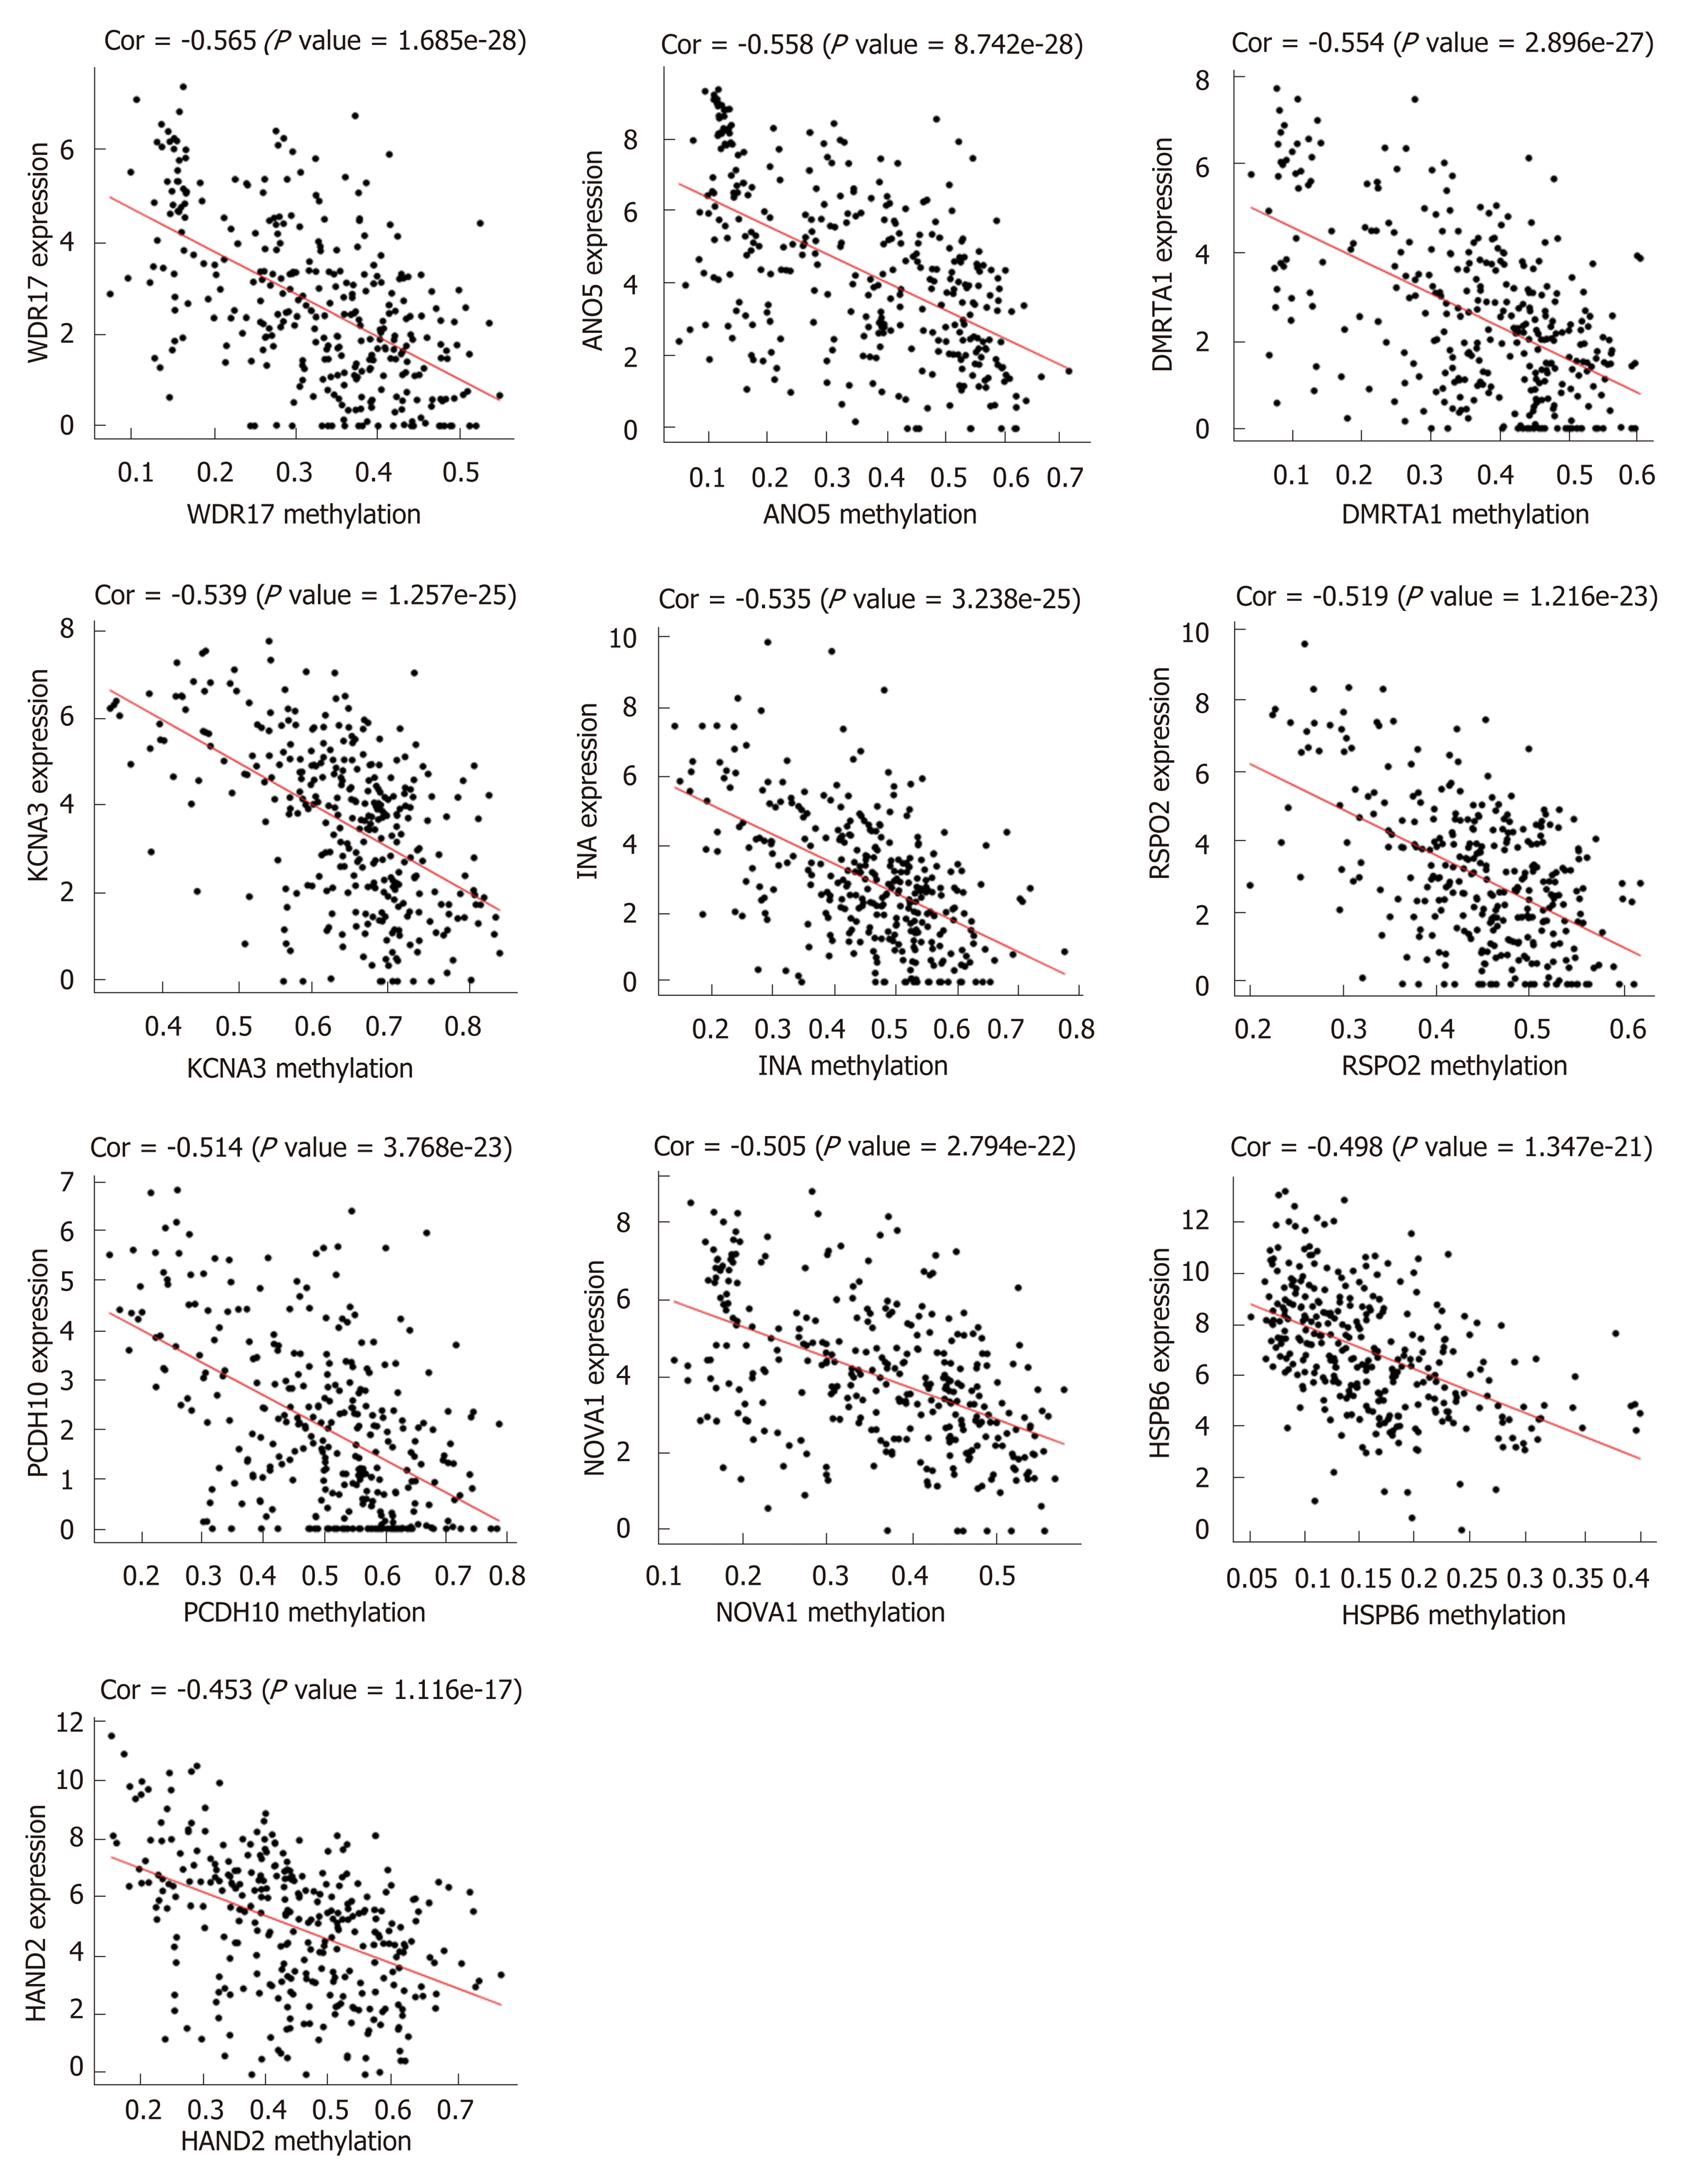
Figure 3 The methylation-regulated differentially expressed genes with the top 10 correlation coefficients.
Spearman’s correlation analysis was performed between methylation (horizontal axis) and expression (vertical axis) of methylation-regulated differentially expressed genes. Spearman’s correlation coefficient and P-values are shown in each plot.
- Citation: Liang Y, Zhang C, Dai DQ. Identification of differentially expressed genes regulated by methylation in colon cancer based on bioinformatics analysis. World J Gastroenterol 2019; 25(26): 3392-3407
- URL: https://www.wjgnet.com/1007-9327/full/v25/i26/3392.htm
- DOI: https://dx.doi.org/10.3748/wjg.v25.i26.3392


