Copyright
©The Author(s) 2019.
World J Gastroenterol. Jul 14, 2019; 25(26): 3392-3407
Published online Jul 14, 2019. doi: 10.3748/wjg.v25.i26.3392
Published online Jul 14, 2019. doi: 10.3748/wjg.v25.i26.3392
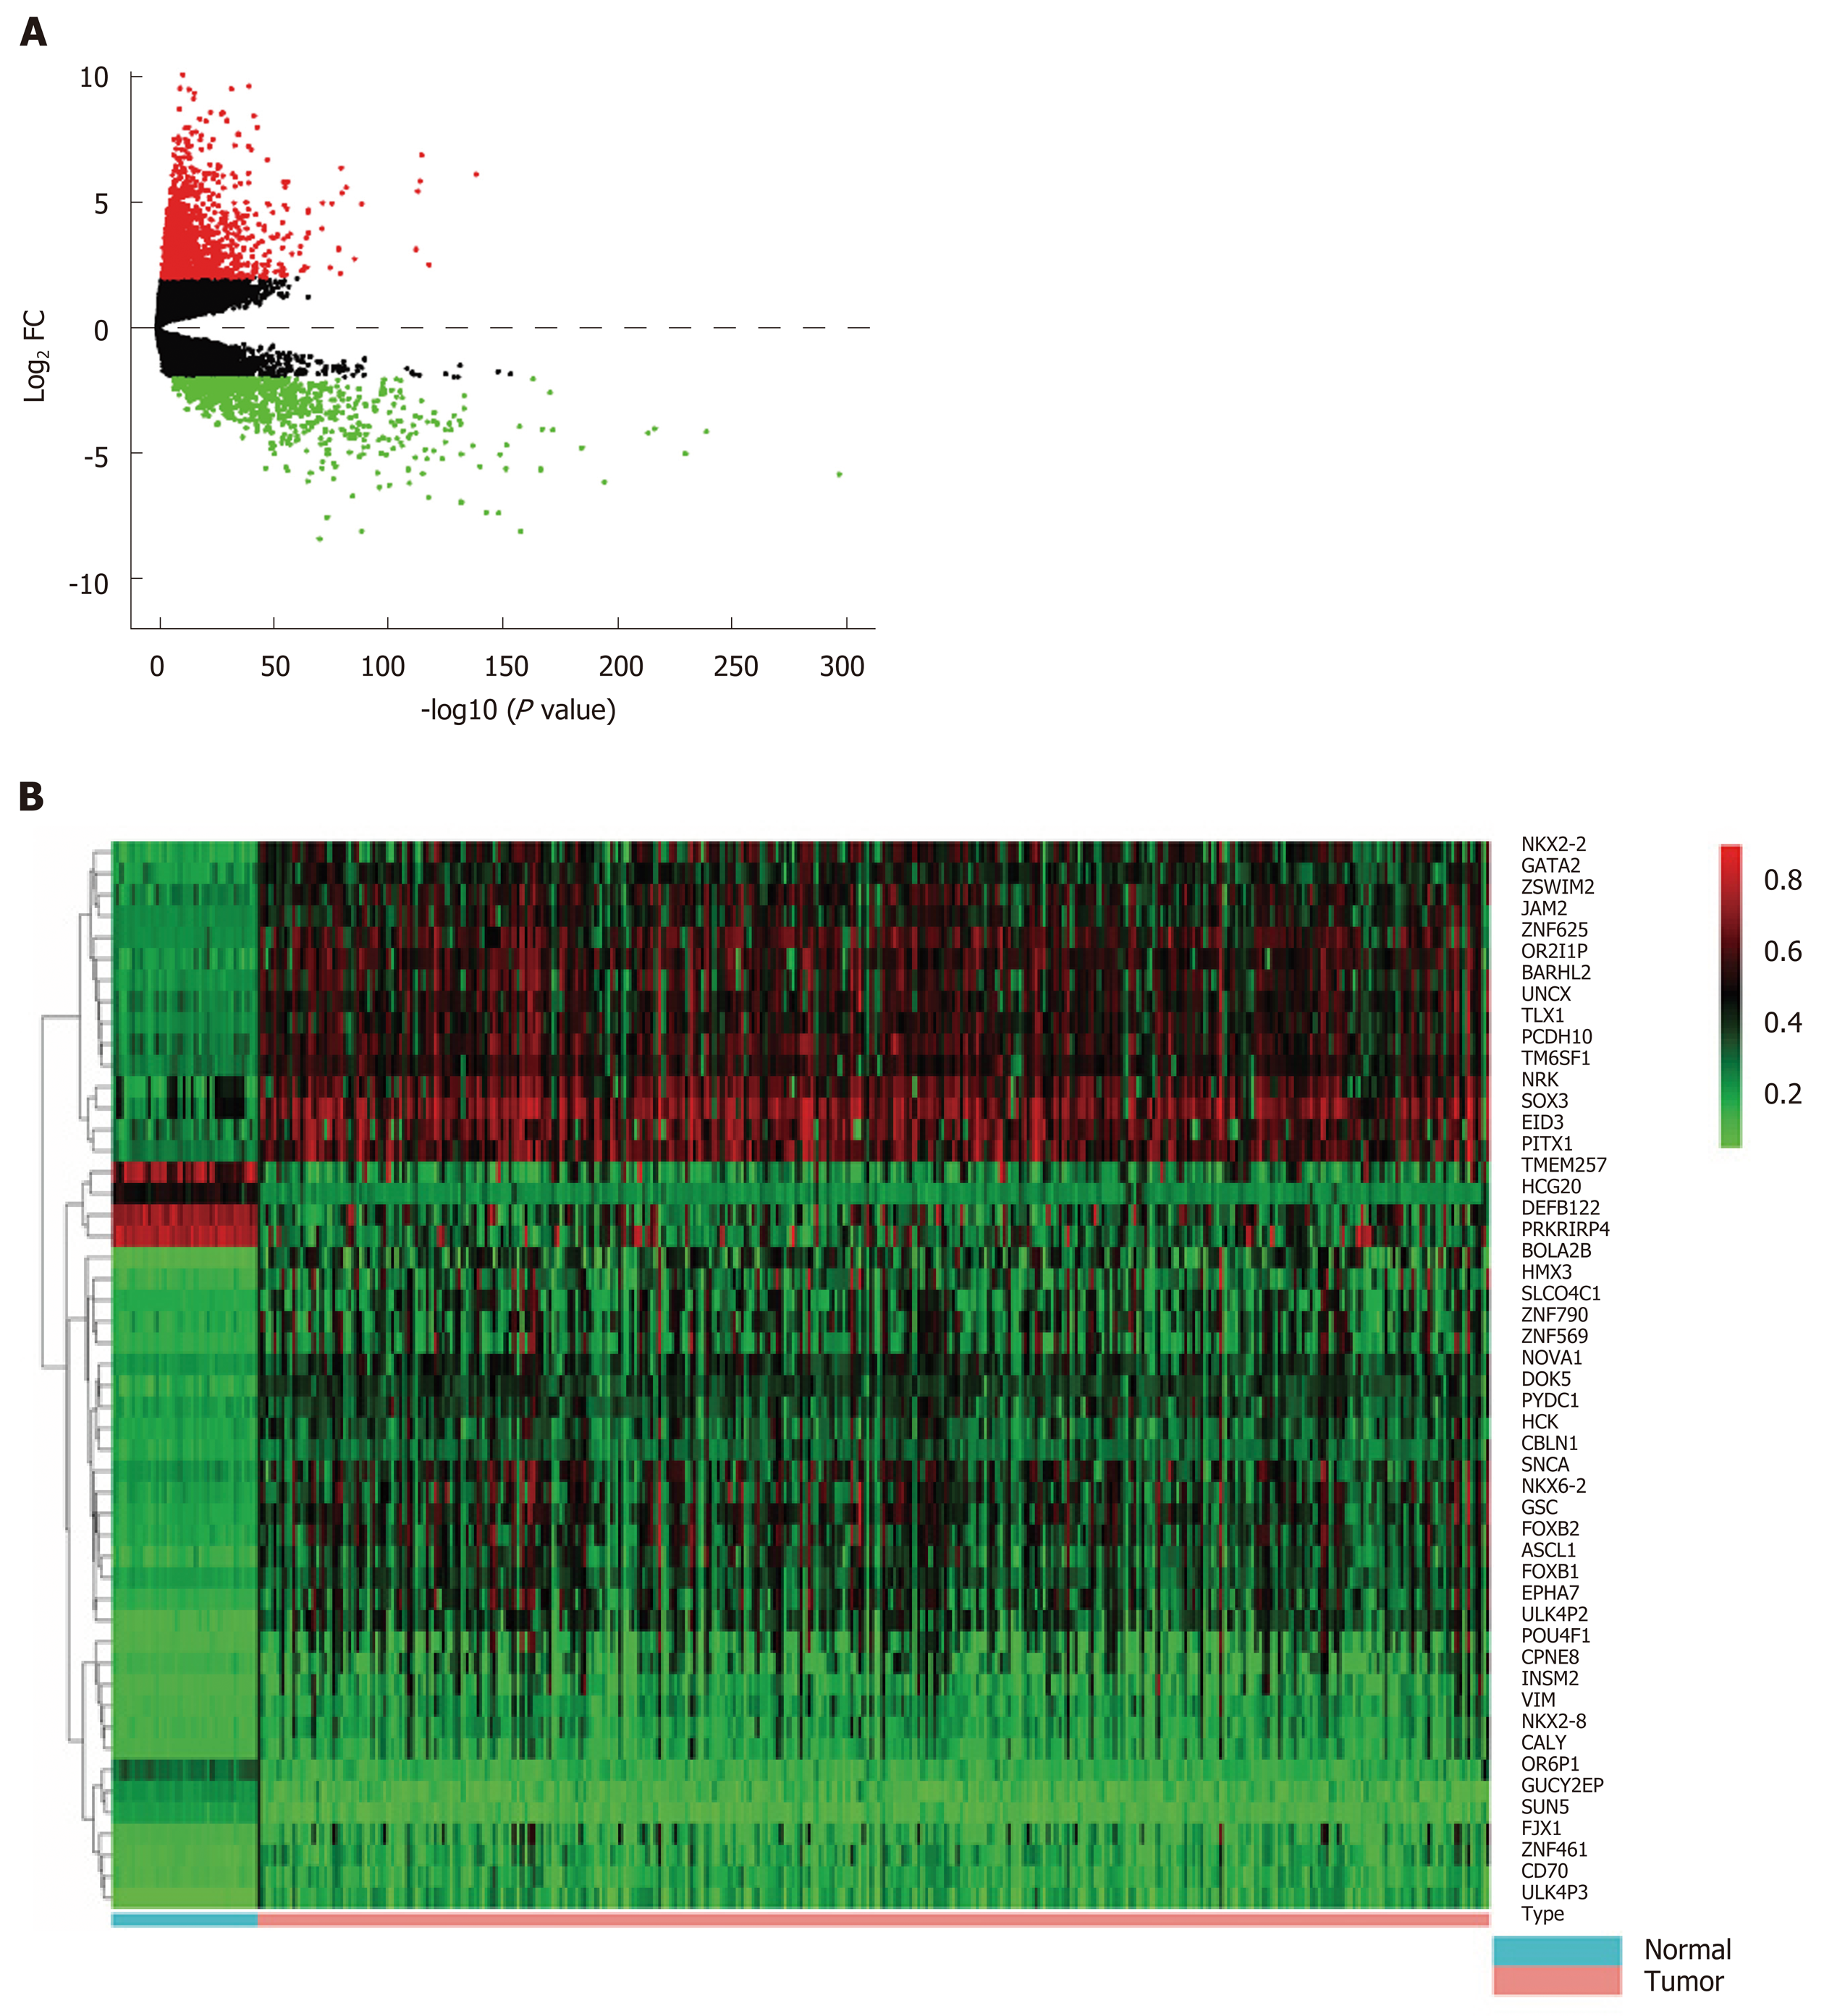
Figure 1 Differentially expressed genes and differentially methylated genes identified from The Cancer Genome Atlas project database.
A: Volcano plot of differentially expressed genes between colon cancer and normal tissues [log2 fold change (FC) > 2, P < 0.01]. Red dots represent up-regulated genes and green dots represent down-regulated genes. Black dots represent the genes with a fold-change in expression of <2; B: Heat map of the top 50 differentially methylated genes (DMGs) (log2 FC > 1, P < 0.01). The left vertical axis shows clusters of DMGs and right vertical axis represents gene names. Red represents hypermethylated genes and green represents hypomethylated genes. DMGs: Differentially methylated genes; FC: Fold change.
- Citation: Liang Y, Zhang C, Dai DQ. Identification of differentially expressed genes regulated by methylation in colon cancer based on bioinformatics analysis. World J Gastroenterol 2019; 25(26): 3392-3407
- URL: https://www.wjgnet.com/1007-9327/full/v25/i26/3392.htm
- DOI: https://dx.doi.org/10.3748/wjg.v25.i26.3392


