Copyright
©The Author(s) 2019.
World J Gastroenterol. Jul 7, 2019; 25(25): 3242-3255
Published online Jul 7, 2019. doi: 10.3748/wjg.v25.i25.3242
Published online Jul 7, 2019. doi: 10.3748/wjg.v25.i25.3242
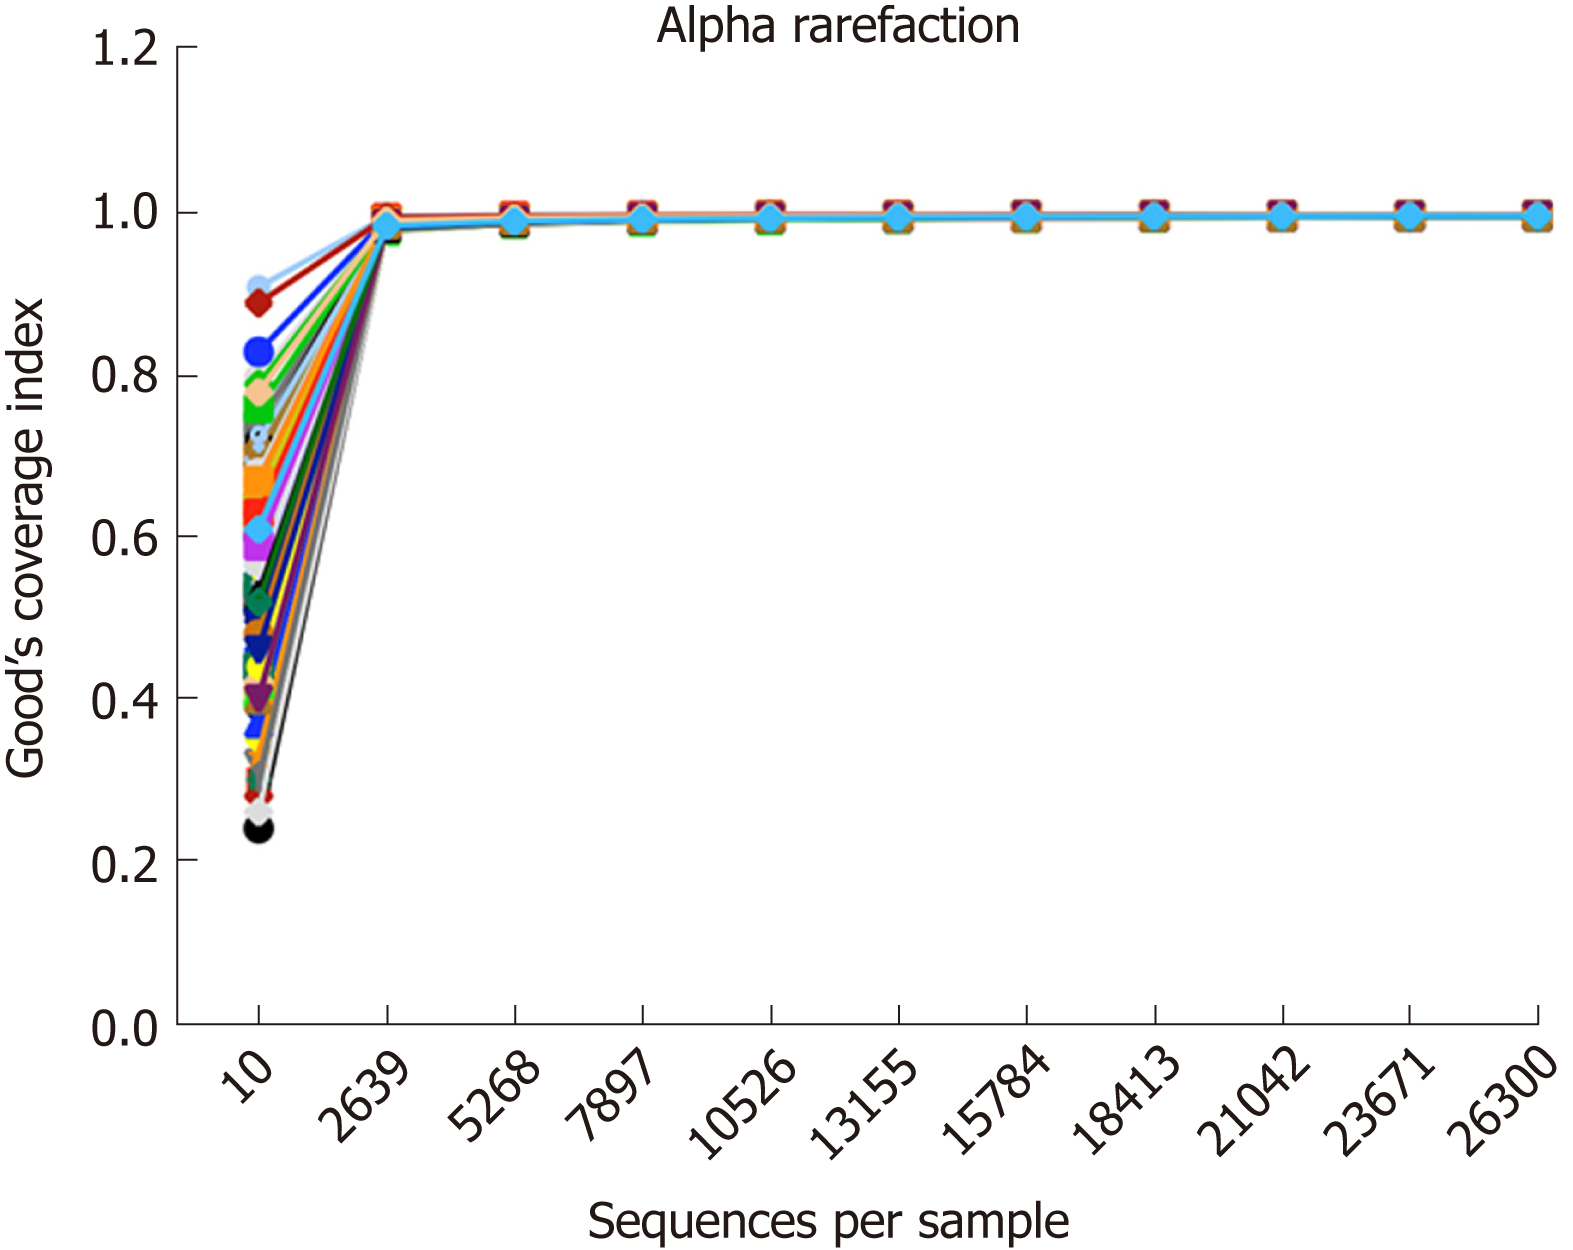
Figure 1 Rarefaction curves of all samples.
The rarefaction curve of each sample reached a plateau when approximately 2700 sequences per sample were extracted, and Good’s coverage estimator for each group approached 100% (> 98.9%).
- Citation: Zhang YL, Cai LT, Qi JY, Lin YZ, Dai YC, Jiao N, Chen YL, Zheng L, Wang BB, Zhu LX, Tang ZP, Zhu RX. Gut microbiota contributes to the distinction between two traditional Chinese medicine syndromes of ulcerative colitis. World J Gastroenterol 2019; 25(25): 3242-3255
- URL: https://www.wjgnet.com/1007-9327/full/v25/i25/3242.htm
- DOI: https://dx.doi.org/10.3748/wjg.v25.i25.3242


