Copyright
©The Author(s) 2019.
World J Gastroenterol. Jul 7, 2019; 25(25): 3218-3230
Published online Jul 7, 2019. doi: 10.3748/wjg.v25.i25.3218
Published online Jul 7, 2019. doi: 10.3748/wjg.v25.i25.3218
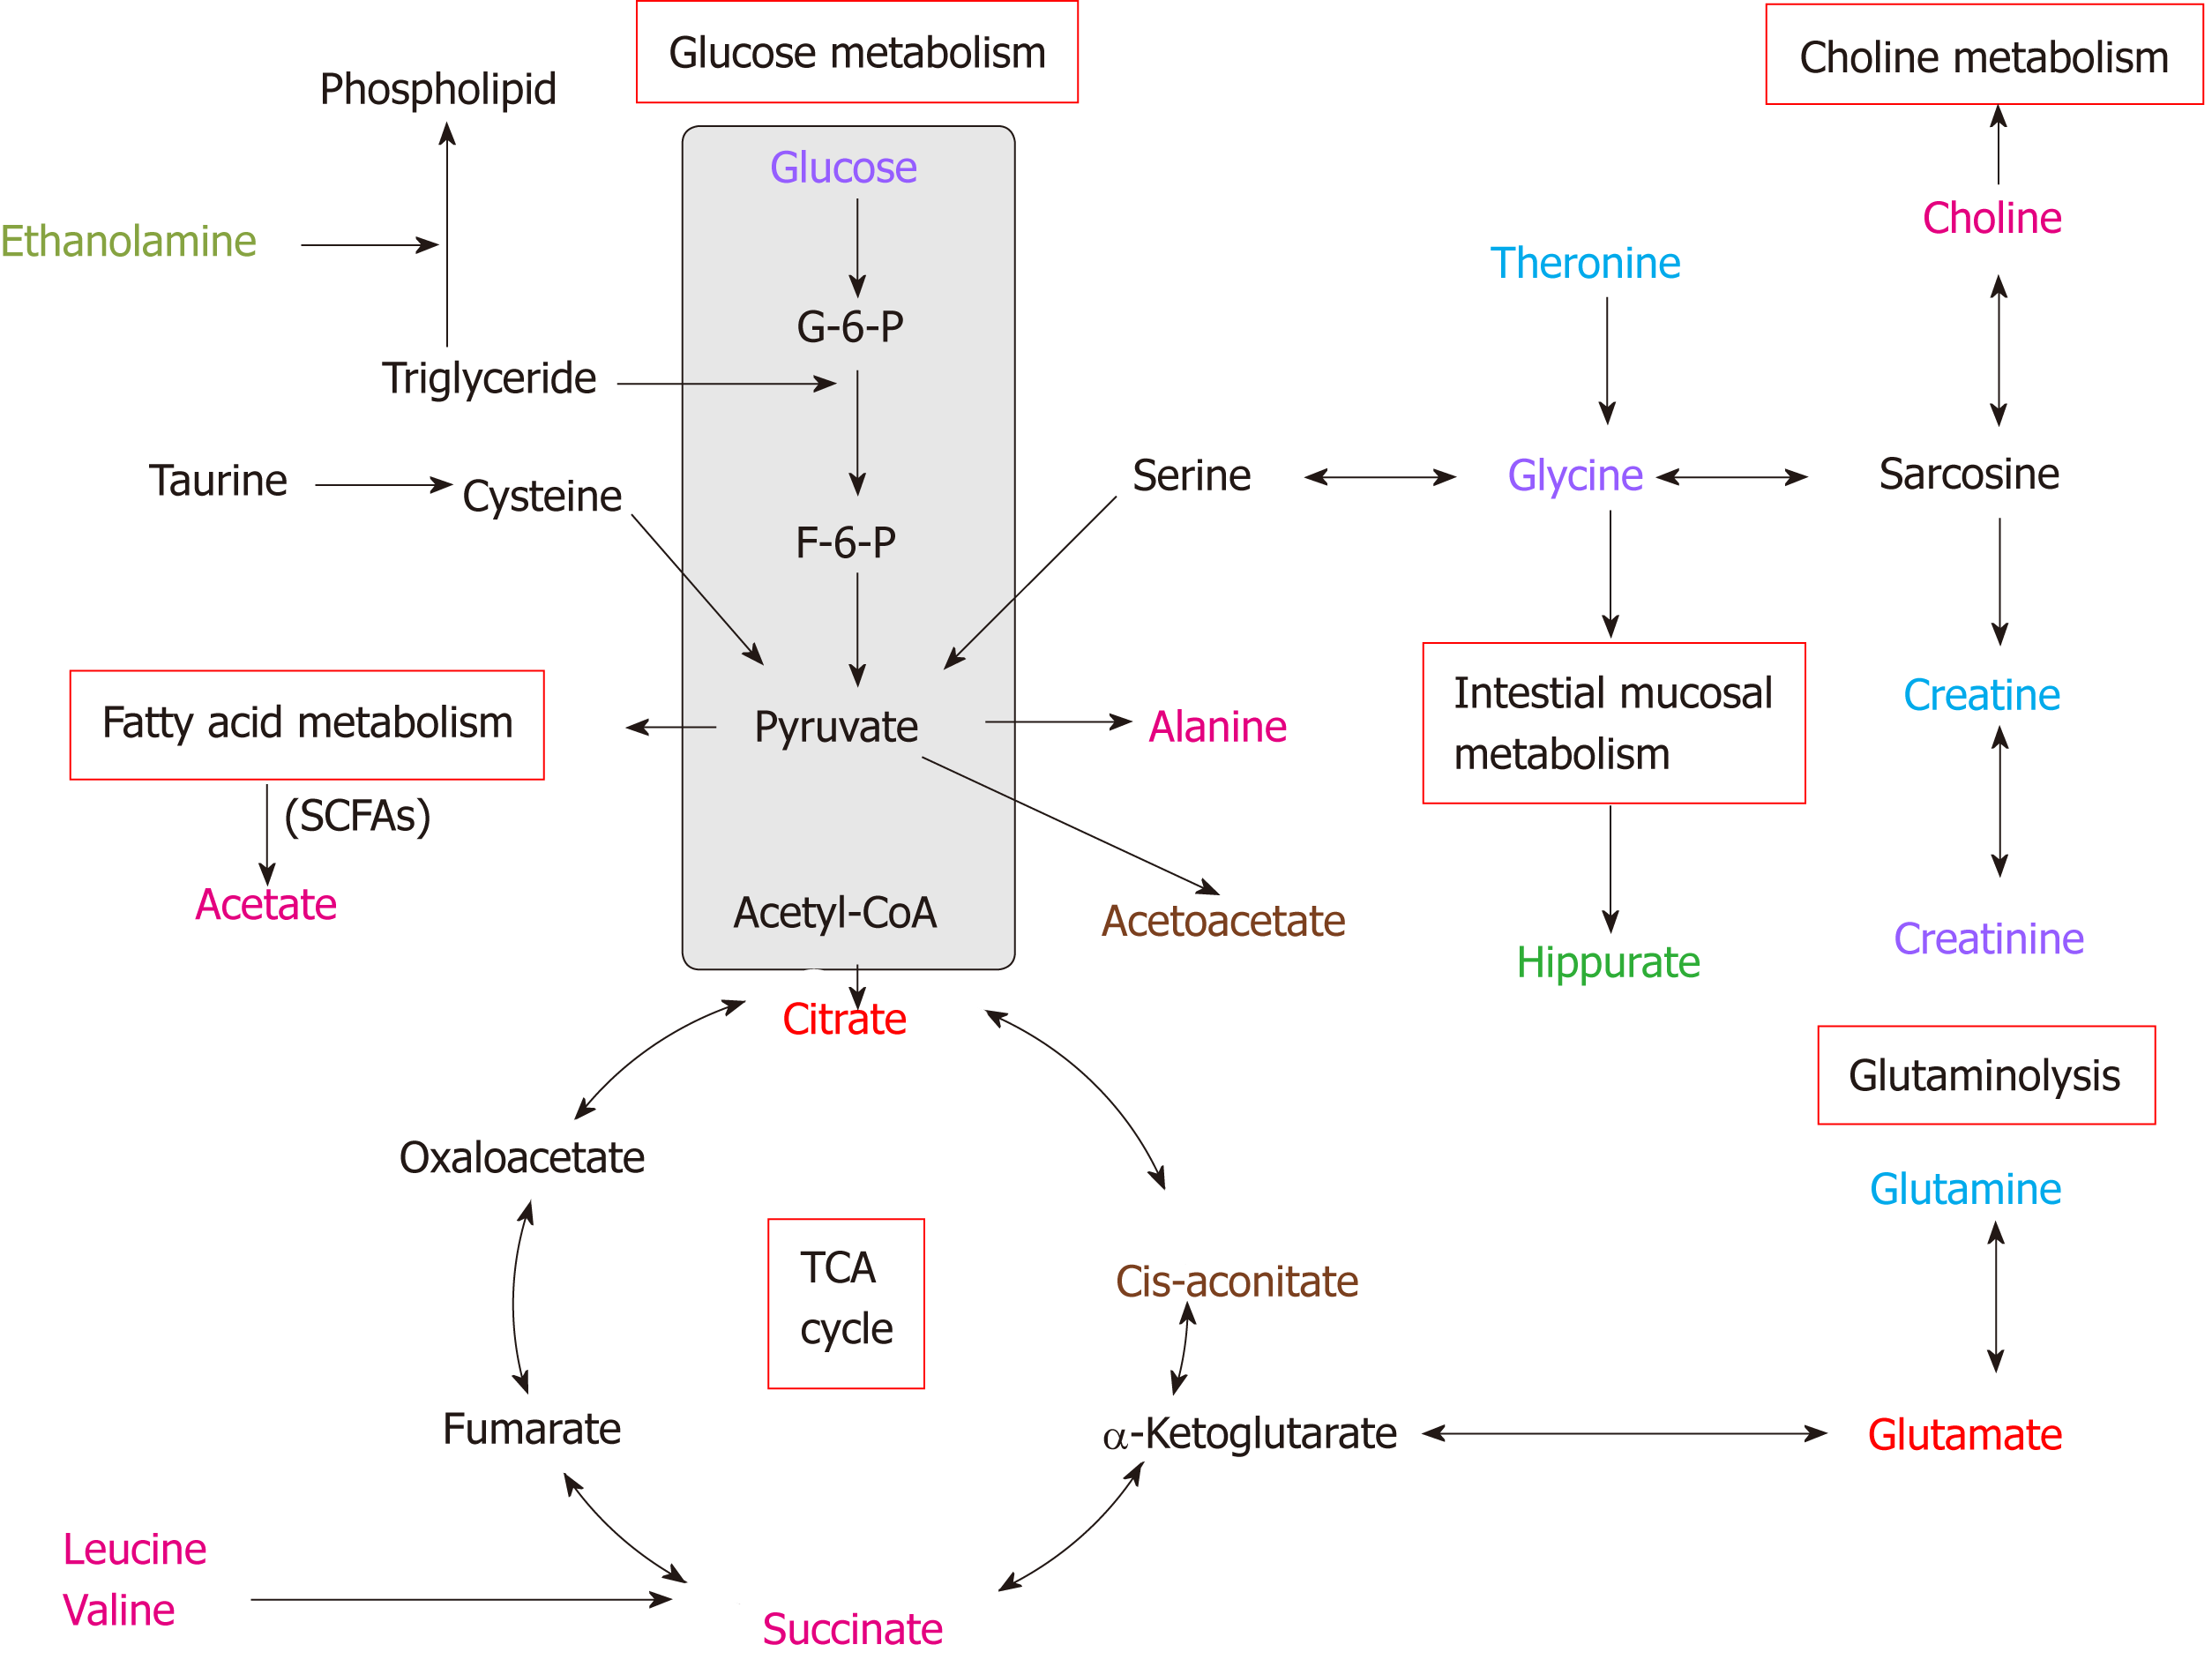
Figure 5 Altered metabolic pathways for the most relevant distinguishing metabolites (potential biomarkers) in urine and tissue samples between esophageal cancer patients and healthy controls.
Red text: Increased with respect to control in both esophageal cancer (EC) patient tissue and urine; pink text: Increased with respect to control in EC tissue; orange text: Increased with respect to control in EC patient urine; purple text: Decreased with respect to control in both EC patient tissue and urine; blue text: Decreased with respect to control in EC tissue; green text: Decreased with respect to control in EC patient urine.
- Citation: Liang JH, Lin Y, Ouyang T, Tang W, Huang Y, Ye W, Zhao JY, Wang ZN, Ma CC. Nuclear magnetic resonance-based metabolomics and metabolic pathway networks from patient-matched esophageal carcinoma, adjacent noncancerous tissues and urine. World J Gastroenterol 2019; 25(25): 3218-3230
- URL: https://www.wjgnet.com/1007-9327/full/v25/i25/3218.htm
- DOI: https://dx.doi.org/10.3748/wjg.v25.i25.3218


