Copyright
©The Author(s) 2019.
World J Gastroenterol. Jul 7, 2019; 25(25): 3218-3230
Published online Jul 7, 2019. doi: 10.3748/wjg.v25.i25.3218
Published online Jul 7, 2019. doi: 10.3748/wjg.v25.i25.3218
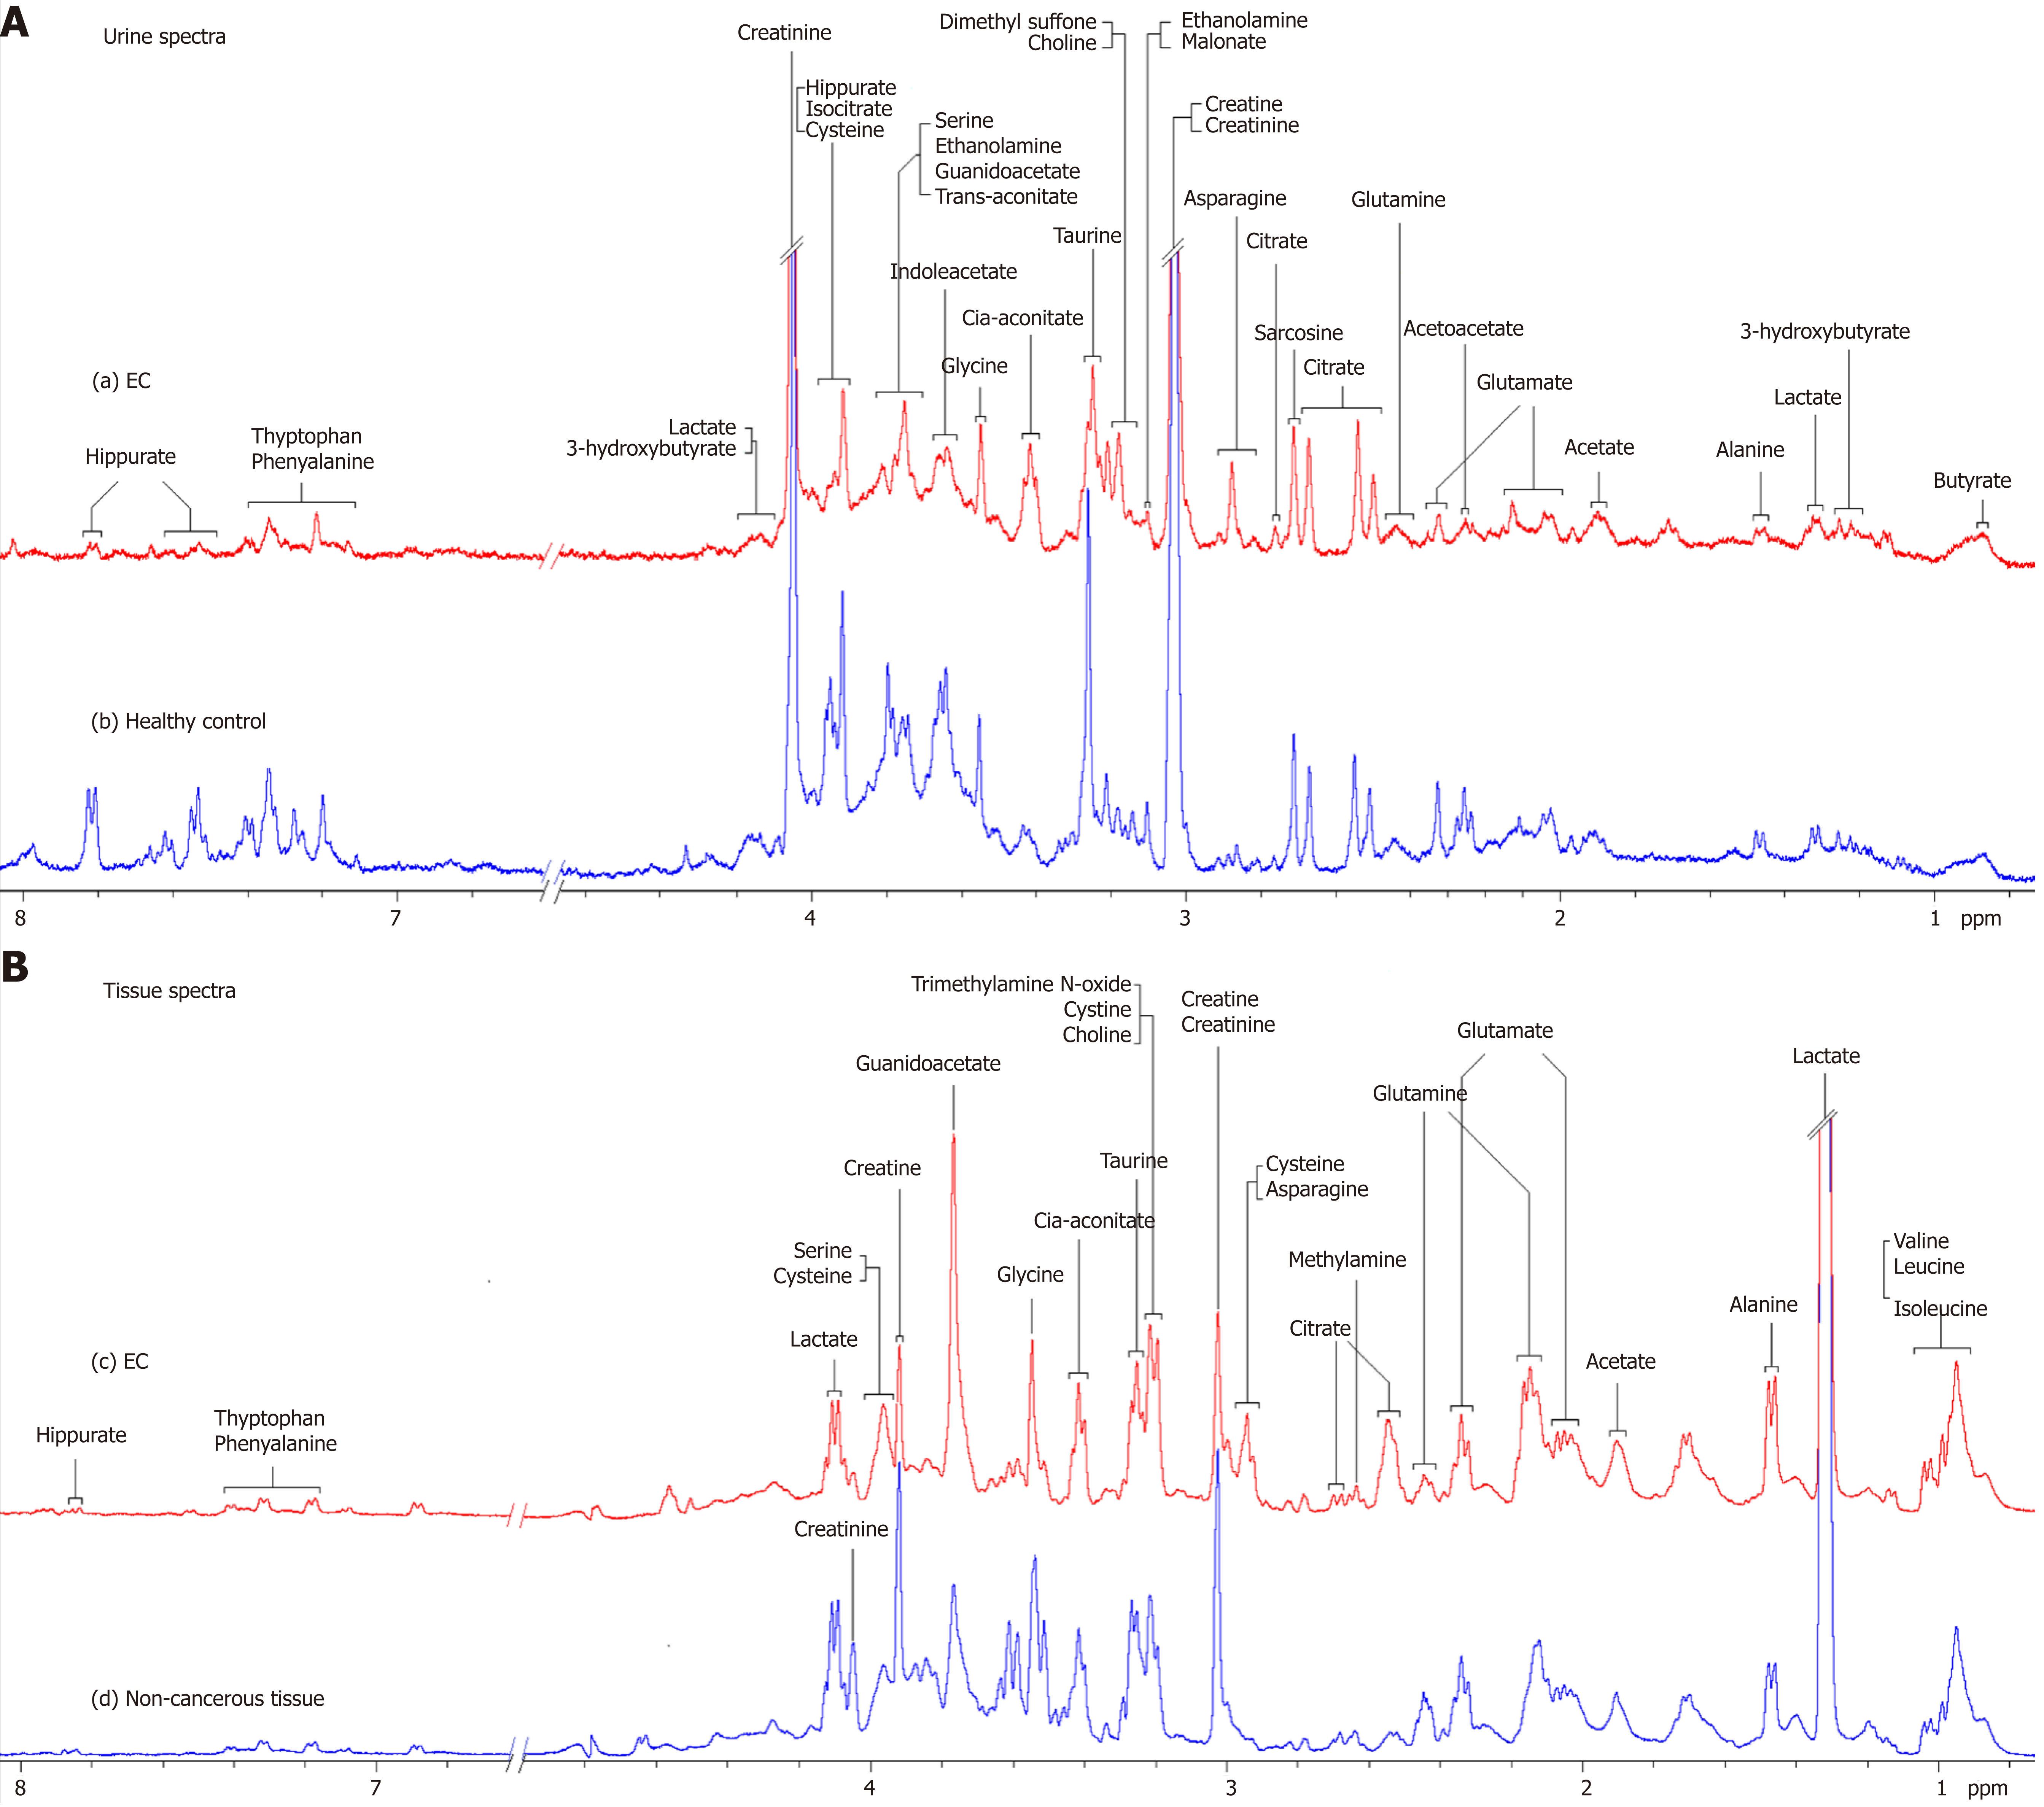
Figure 1 Proton nuclear magnetic resonance spectra.
A: 400 MHz representative urine proton nuclear magnetic resonance (1H-NMR) spectra obtained from esophageal cancer (EC) patient (a) and healthy control (b); B: Tissue 1H-NMR spectra obtained from EC tissue (c) and adjacent noncancerous tissue (d) referenced to tetradeuteriopropionate (0.0 ppm).
- Citation: Liang JH, Lin Y, Ouyang T, Tang W, Huang Y, Ye W, Zhao JY, Wang ZN, Ma CC. Nuclear magnetic resonance-based metabolomics and metabolic pathway networks from patient-matched esophageal carcinoma, adjacent noncancerous tissues and urine. World J Gastroenterol 2019; 25(25): 3218-3230
- URL: https://www.wjgnet.com/1007-9327/full/v25/i25/3218.htm
- DOI: https://dx.doi.org/10.3748/wjg.v25.i25.3218


