Copyright
©The Author(s) 2019.
World J Gastroenterol. Apr 28, 2019; 25(16): 1950-1963
Published online Apr 28, 2019. doi: 10.3748/wjg.v25.i16.1950
Published online Apr 28, 2019. doi: 10.3748/wjg.v25.i16.1950
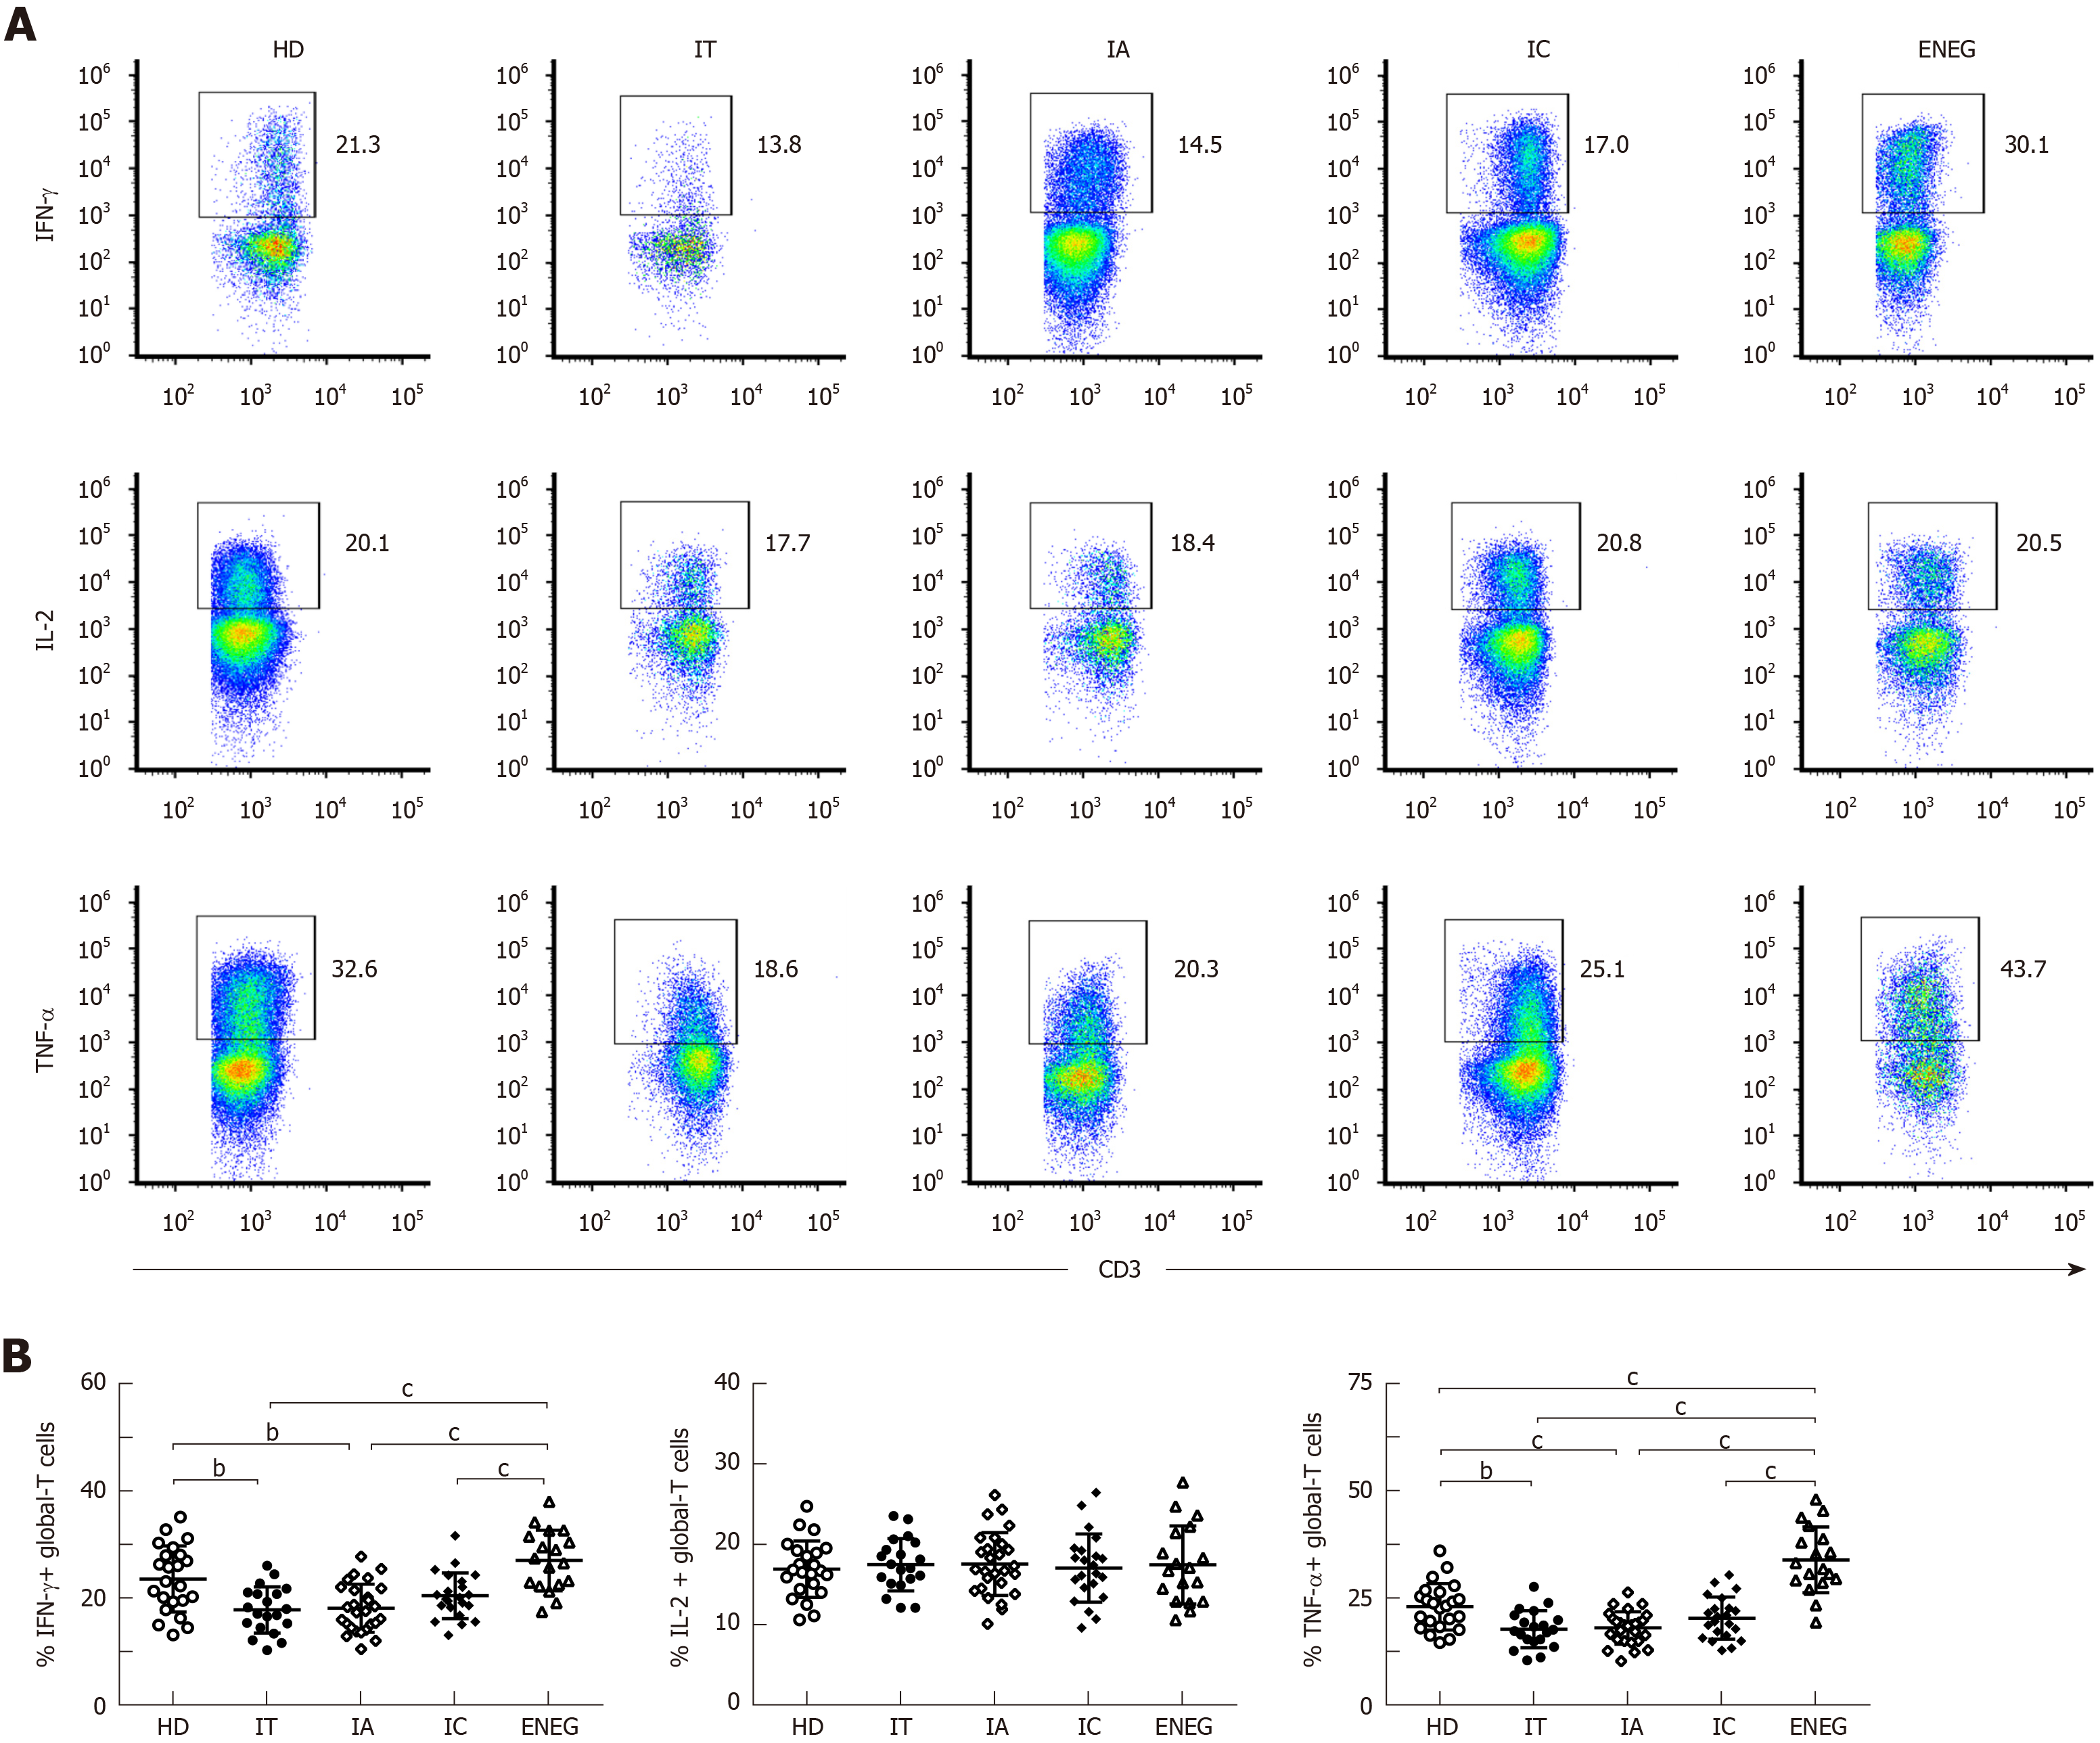
Figure 4 Global-T cell cytokine production in different clinical phases.
Peripheral blood mononuclear cells were stimulated by phorbol myristate acetate and ionomycin. A: Representative dot plots depicting the expression of IFN-γ, IL-2 and TNF-α in global CD3+ T cells; B: Cumulative data showing the frequency of global CD3+ T cells expressing IFN-γ, IL-2 and TNF-α in healthy donors and patients in different clinical phases. IFN-γ: Interferon-gamma; TNF-α: Tumor necrosis factor-alpha; HD: Healthy donors; IT: Immune tolerant; IA: Immune active; IC: Inactive carrier; ENEG: Hepatitis B envelope antigen-negative hepatitis. All data are presented as mean ± SD, aP < 0.05, bP < 0.01, cP < 0.001.
- Citation: Wang WT, Zhao XQ, Li GP, Chen YZ, Wang L, Han MF, Li WN, Chen T, Chen G, Xu D, Ning Q, Zhao XP. Immune response pattern varies with the natural history of chronic hepatitis B. World J Gastroenterol 2019; 25(16): 1950-1963
- URL: https://www.wjgnet.com/1007-9327/full/v25/i16/1950.htm
- DOI: https://dx.doi.org/10.3748/wjg.v25.i16.1950


