Copyright
©The Author(s) 2019.
World J Gastroenterol. Mar 14, 2019; 25(10): 1248-1258
Published online Mar 14, 2019. doi: 10.3748/wjg.v25.i10.1248
Published online Mar 14, 2019. doi: 10.3748/wjg.v25.i10.1248
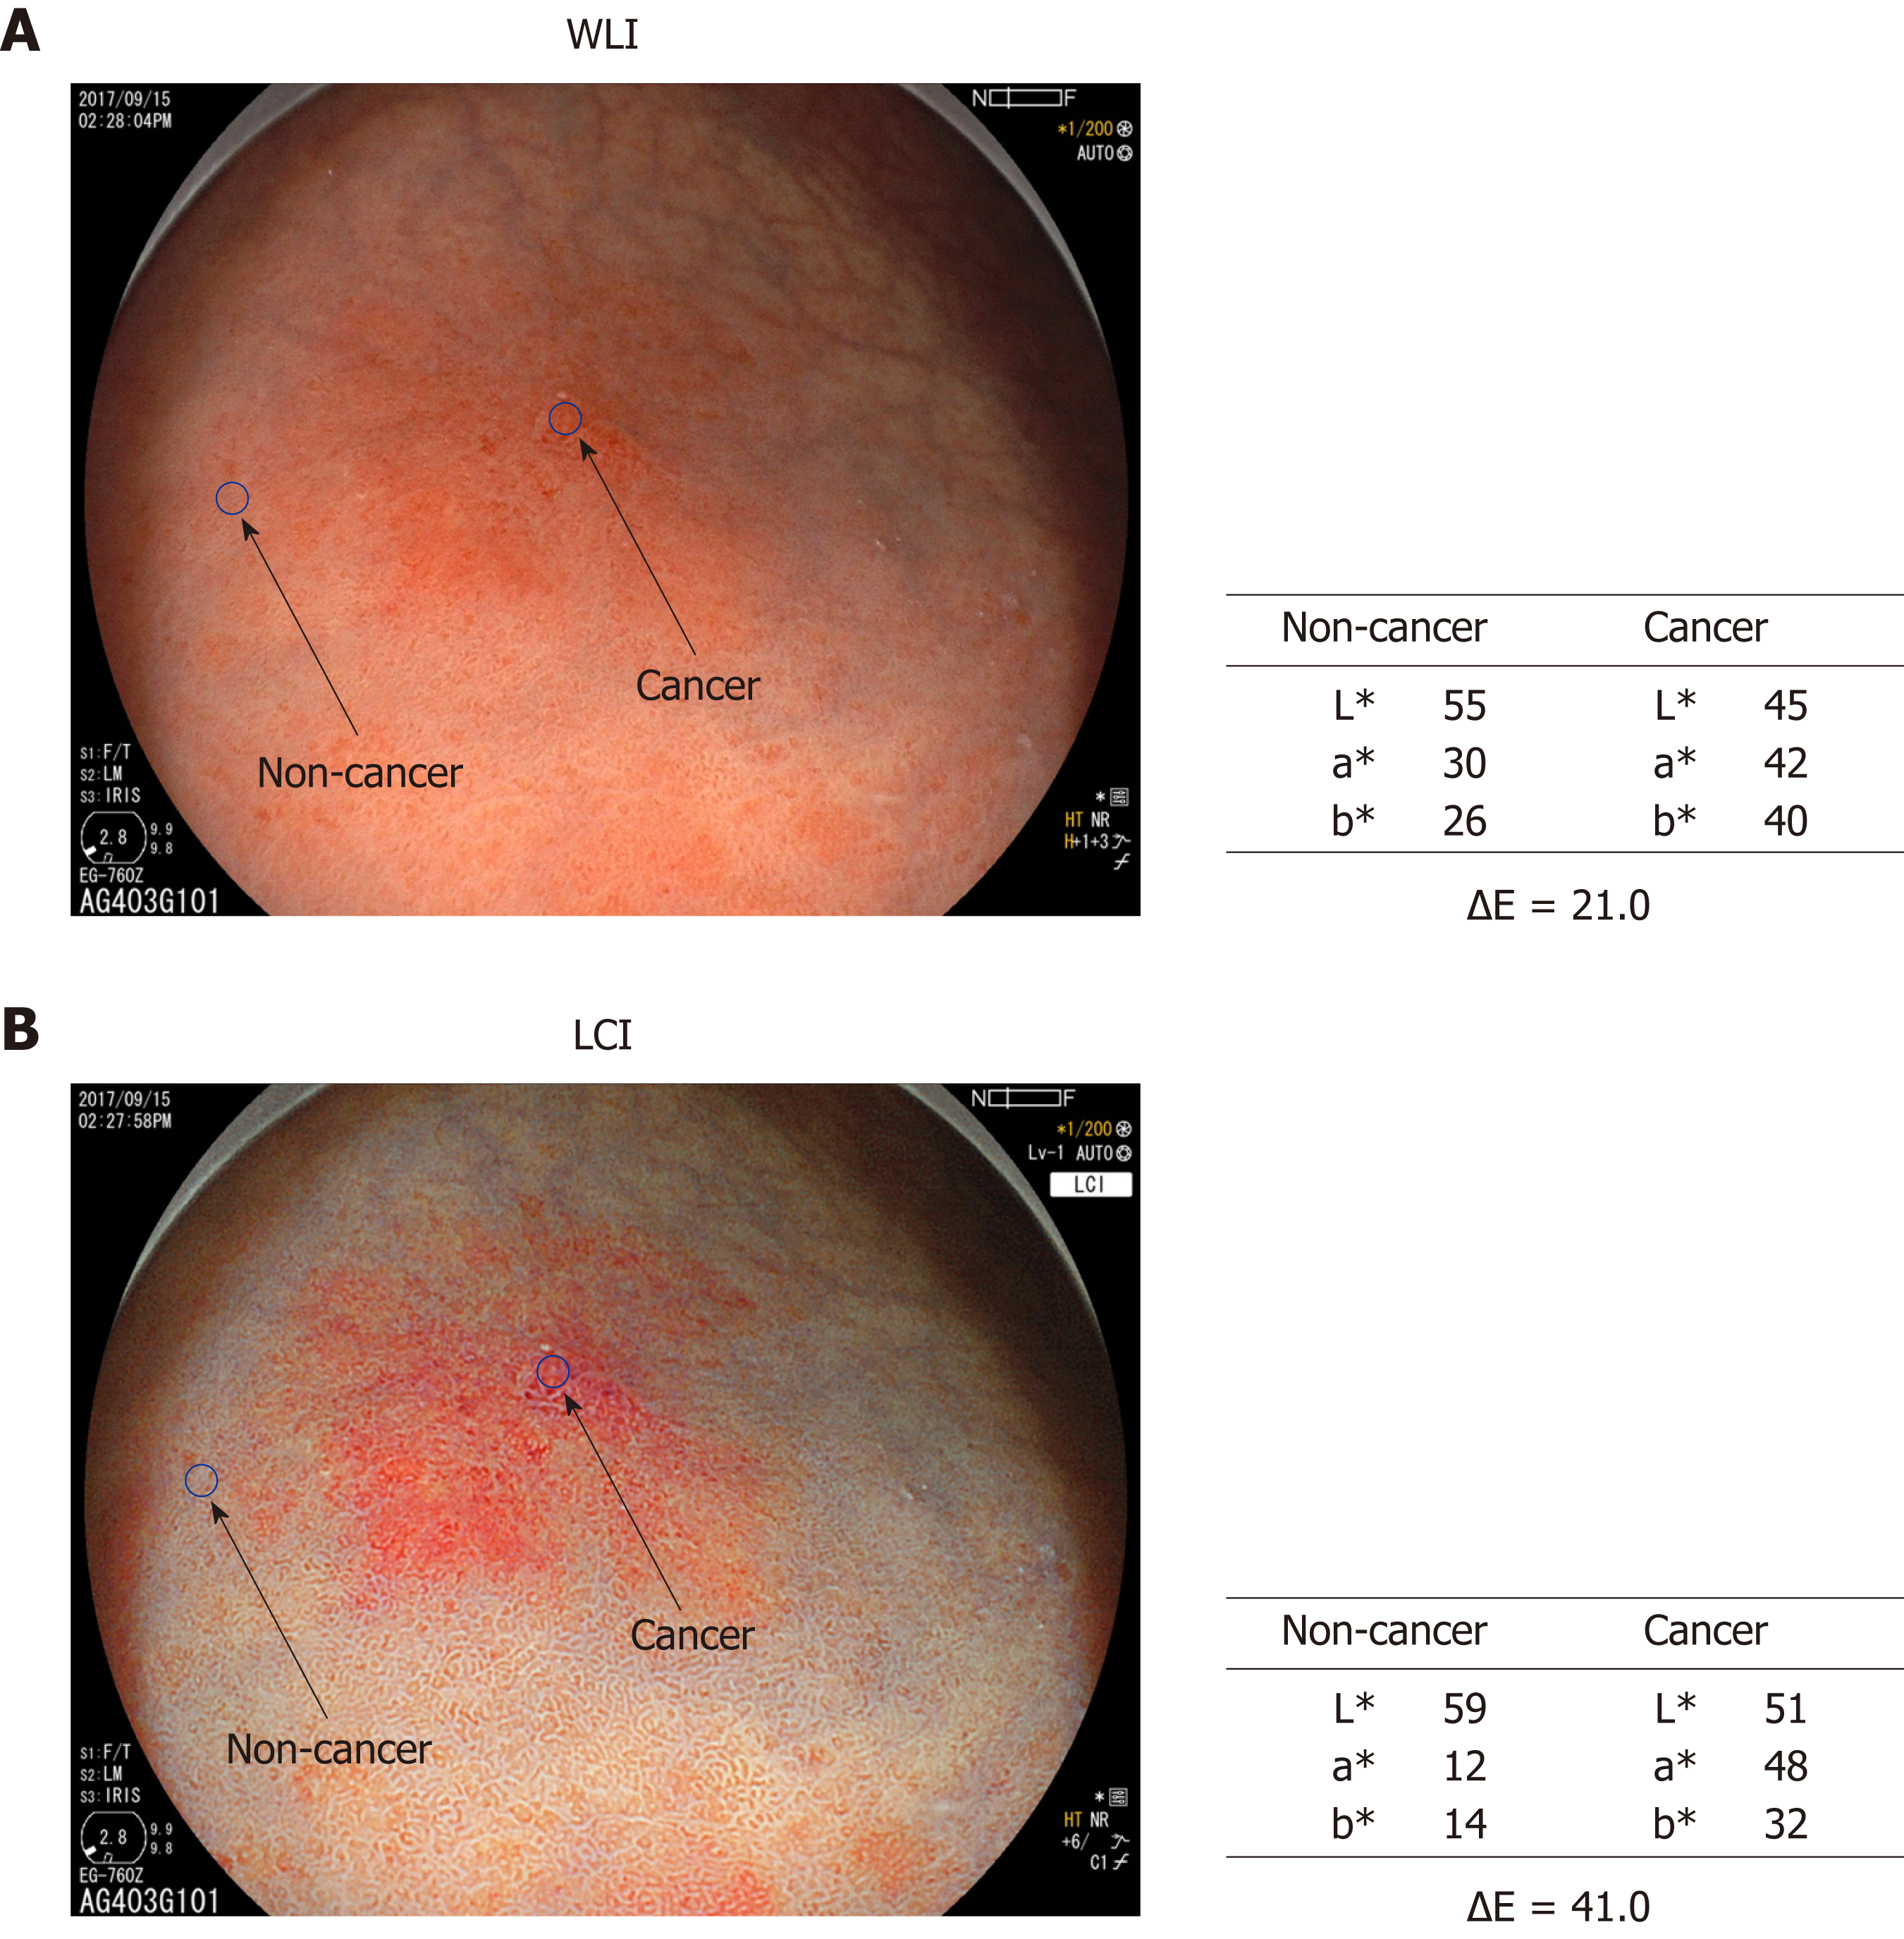
Figure 1 Color values and color differences between cancer and non- cancer areas.
A region of interest (diameter: 24 pixels) was established in each lesion. Color values (L*, a*, b*) were measured using Adobe Photoshop CS4 to estimate color differences (ΔE) between cancer and non-cancer areas. The results are shown in Table 2. WLI: White light imaging; LCI: Linked color imaging.
- Citation: Fujiyoshi T, Miyahara R, Funasaka K, Furukawa K, Sawada T, Maeda K, Yamamura T, Ishikawa T, Ohno E, Nakamura M, Kawashima H, Nakaguro M, Nakatochi M, Hirooka Y. Utility of linked color imaging for endoscopic diagnosis of early gastric cancer. World J Gastroenterol 2019; 25(10): 1248-1258
- URL: https://www.wjgnet.com/1007-9327/full/v25/i10/1248.htm
- DOI: https://dx.doi.org/10.3748/wjg.v25.i10.1248


