Copyright
©The Author(s) 2018.
World J Gastroenterol. Jun 21, 2018; 24(23): 2468-2481
Published online Jun 21, 2018. doi: 10.3748/wjg.v24.i23.2468
Published online Jun 21, 2018. doi: 10.3748/wjg.v24.i23.2468
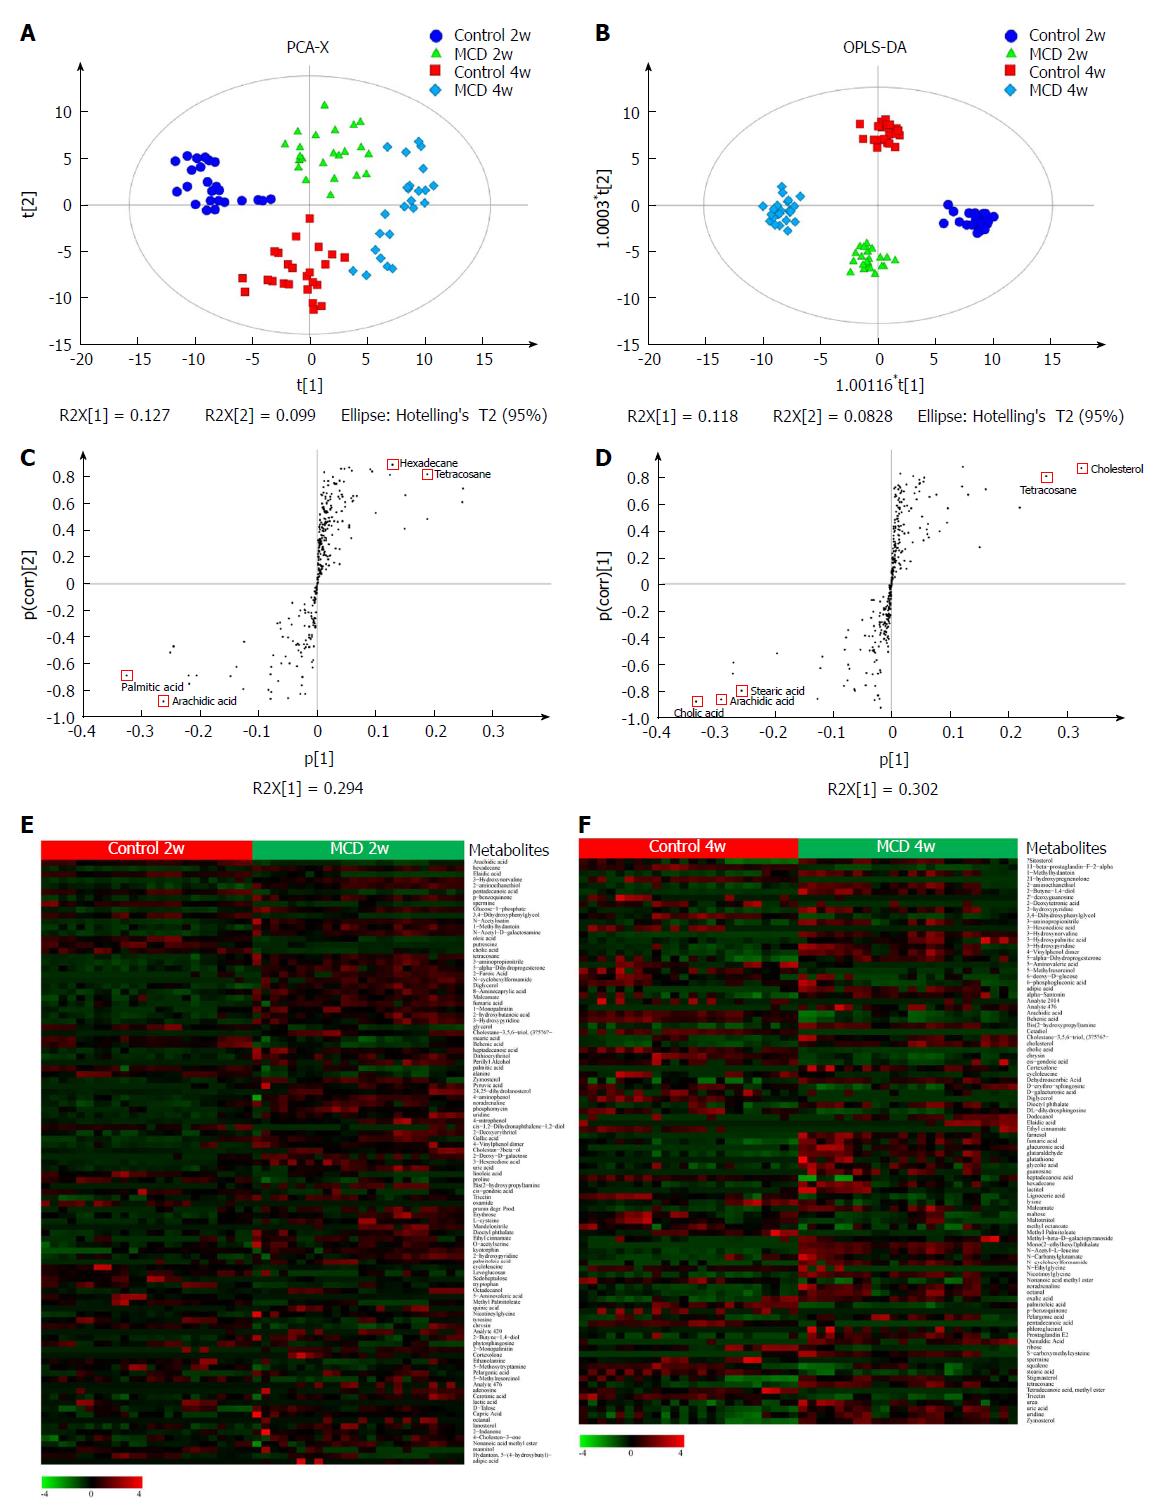
Figure 5 Methionine-choline-deficient diet altered the fecal metabolomic profile during nonalcoholic steatohepatitis progression.
A: 4-state model of a PCA plot comparing between the Control 2w (cycle), MCD 2w (triangle), Control 4w (square), and MCD 4w groups (diamond). B: OPLS-DA score scatter plot comparing the Control 2w (cycle), MCD 2w (triangle), Control 4w (square), and MCD 4w groups (diamond). Each symbol represents one sample (n = 24 per group, with a quadruplicate technical replicates of 6 samples per group). C-D: S-plot constructed from the OPLS-DA model at 2 wk (C) and 4 wk (D). The selected metabolites (red triangles) are located in the upper far right and lower far left with considerable potential as biomarkers and marked discrimination between the groups. E-F: Euclidean distance hierarchical clustering analysis visualizing the different intensity levels of characteristic metabolites at 2 wk (E) and 4 wk (F). PCA: Principal component analysis; MCD: Methionine-choline-deficient; OPLS-DA: Orthogonal partial least-squares-discriminant analysis.
- Citation: Ye JZ, Li YT, Wu WR, Shi D, Fang DQ, Yang LY, Bian XY, Wu JJ, Wang Q, Jiang XW, Peng CG, Ye WC, Xia PC, Li LJ. Dynamic alterations in the gut microbiota and metabolome during the development of methionine-choline-deficient diet-induced nonalcoholic steatohepatitis. World J Gastroenterol 2018; 24(23): 2468-2481
- URL: https://www.wjgnet.com/1007-9327/full/v24/i23/2468.htm
- DOI: https://dx.doi.org/10.3748/wjg.v24.i23.2468


