Copyright
©The Author(s) 2018.
World J Gastroenterol. Jun 21, 2018; 24(23): 2468-2481
Published online Jun 21, 2018. doi: 10.3748/wjg.v24.i23.2468
Published online Jun 21, 2018. doi: 10.3748/wjg.v24.i23.2468
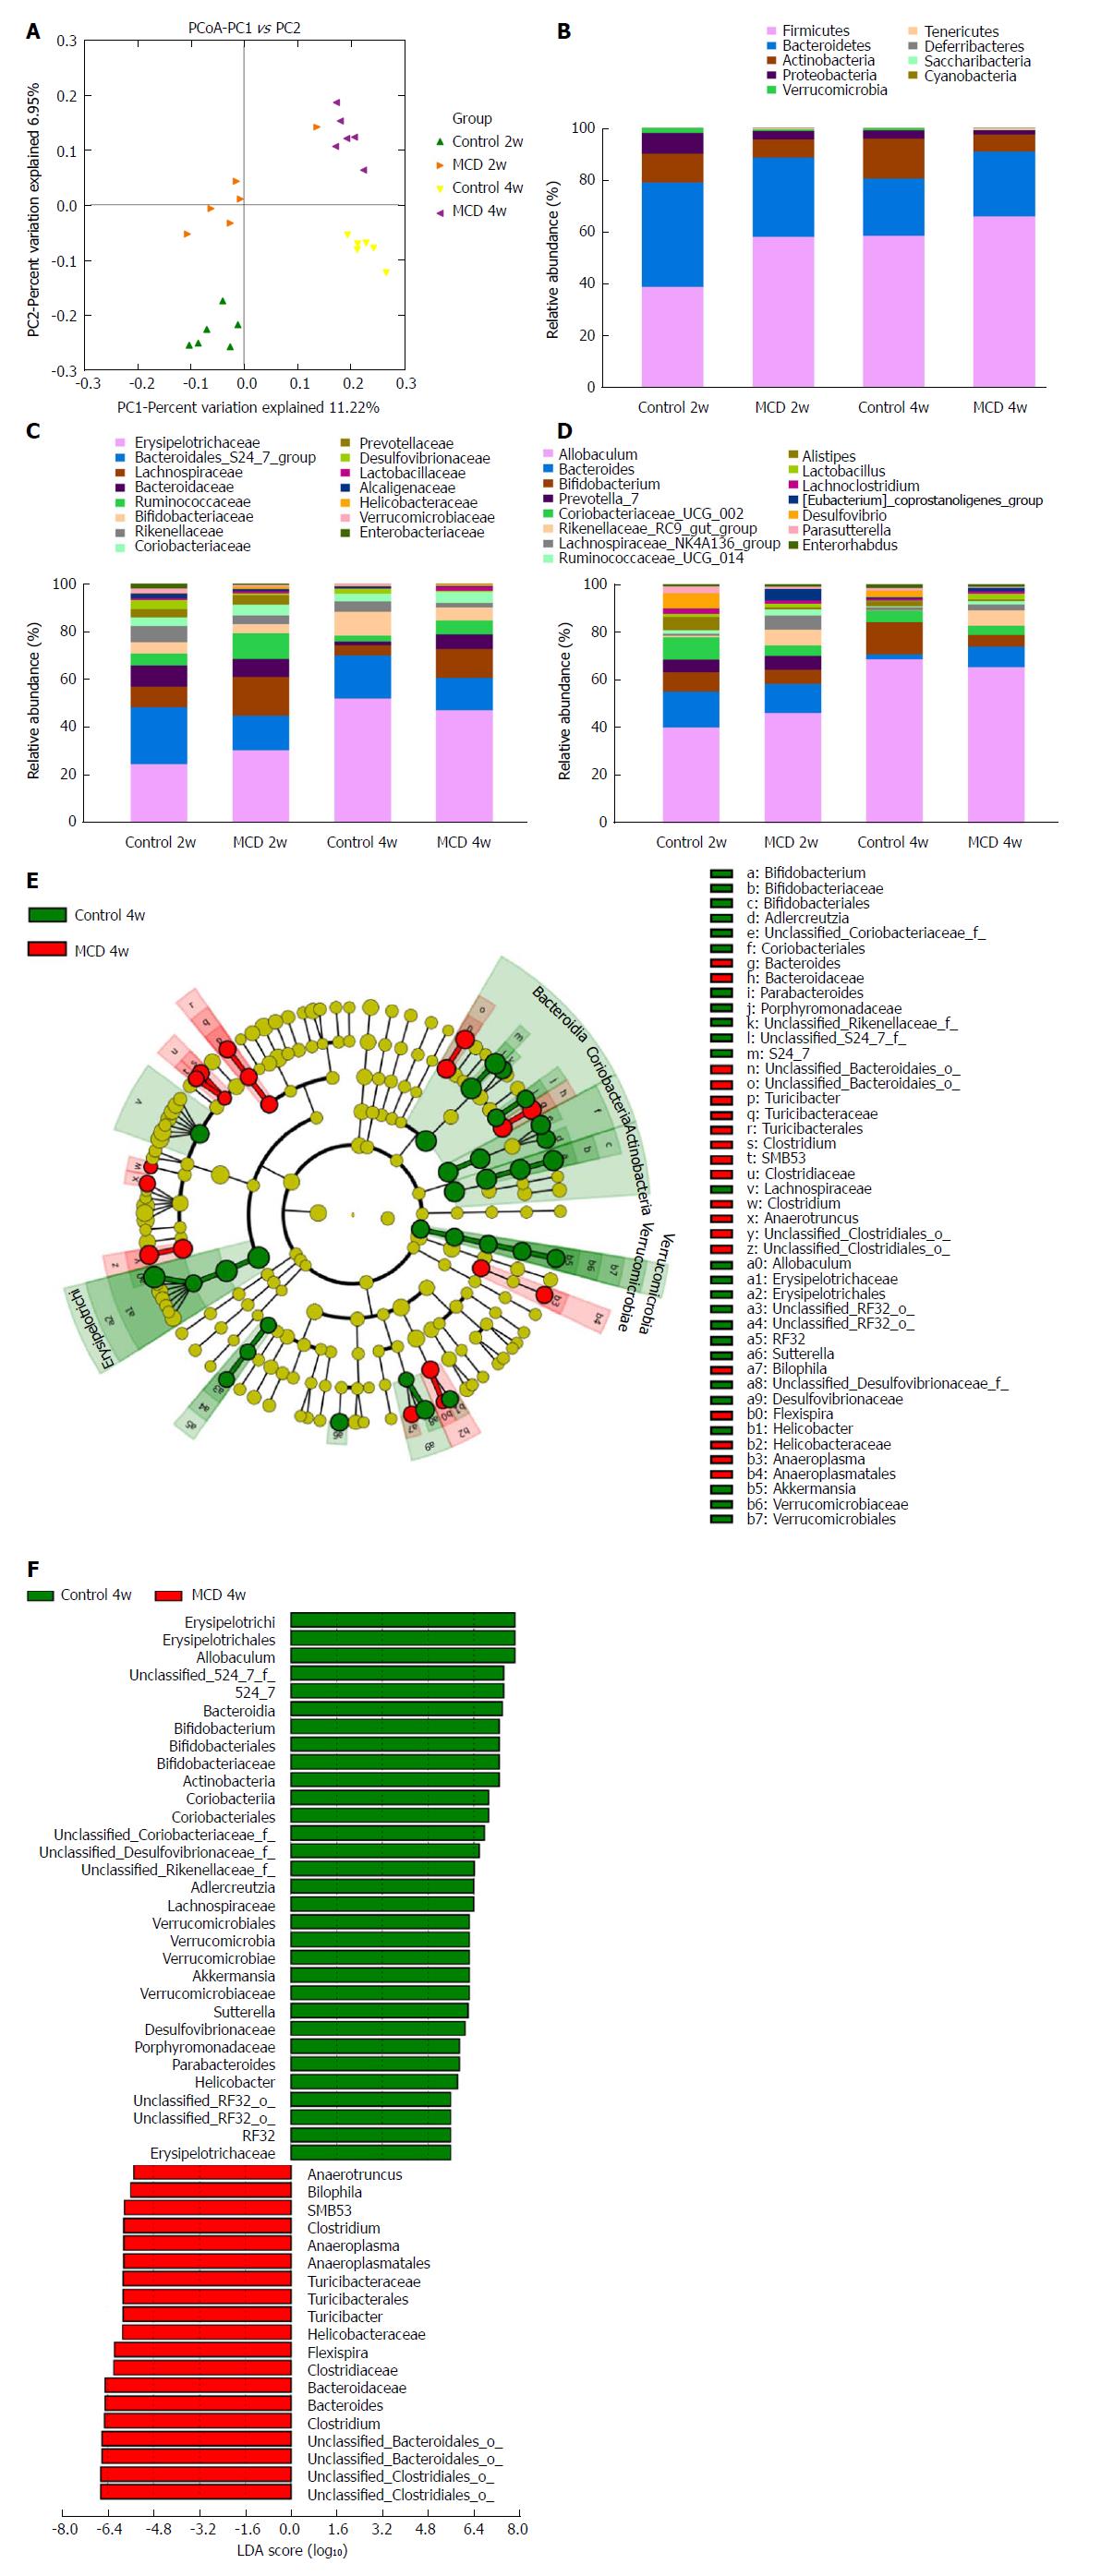
Figure 4 Methionine-choline-deficient diet induced gut microbiota dysbiosis.
A: PCoA plot of the microbiota based on unweighted UniFrac metric. Each symbol represents one sample (n = 6 per group). B-D: Top most abundant taxa at the phylum (B), family (C), and genus (D) levels. E: LEfSe cladogram represented taxon enriched in the Control 4w group (green) and in the MCD 4w group (red). Rings from the inside out represented taxonomic levels from phylum to genus. Sizes of the circles indicate the relative abundance levels of the taxa. F: Discriminative biomarkers with an LDA score > 4.8. MCD: Methionine-choline-deficient.
- Citation: Ye JZ, Li YT, Wu WR, Shi D, Fang DQ, Yang LY, Bian XY, Wu JJ, Wang Q, Jiang XW, Peng CG, Ye WC, Xia PC, Li LJ. Dynamic alterations in the gut microbiota and metabolome during the development of methionine-choline-deficient diet-induced nonalcoholic steatohepatitis. World J Gastroenterol 2018; 24(23): 2468-2481
- URL: https://www.wjgnet.com/1007-9327/full/v24/i23/2468.htm
- DOI: https://dx.doi.org/10.3748/wjg.v24.i23.2468


